Impromptu
is the software application that is used to create, customize, and print
MedSelect, Centrack, and SupplySource Examiner reports. Examiner includes a variety of standard
reports that you can view and print without performing any customization (see
page 10
for a list of these standard reports).
The instructions that follow show you how to access and print these
standard reports. There are also standard
Auto-Reports that you can schedule to be run on a daily, weekly, or monthly
basis.
Impromptu
can also be used to create/modify existing standard reports, and to create
custom reports. These subjects are also
discussed in this book.
The
Impromptu user interface has a Microsoft Windows look and feel. Online help is available from the Help
menu, as well as by using the Screen Help
button. Letting the cursor hover over
any button will reveal the Tool Tip for that button, in addition to providing a
longer explanation in the Status Bar.


The Standard Toolbar

|
New
Open
Close
Save
|
Print
Print Preview
|
Cut
Copy
Paste
Undo
|
Data
Query Data
Sort Ascending
Group
|
Total
Count
Rank
|
Prompt
|
Header
Footer
|
Thumbnail
Snapshot
|
Screen Help
Filter
Drill Through
Create Power Play Power
Cube
|
The Format Toolbar
|
Font Attributes
|
Justify
|
Currency
Borders
Pattern
|
Zoom In
Zoom Out
Whole Page
Page Width
|
The Layout Toolbar
|
Form Frame
Text Frame
List Frame
Picture Frame
Chart Frame
OLE Object
|
Select Parent
Snap to Parent
Group Objects
Properties
|
Align
|
Page Layout
Screen Layout
|
Examiner
reports are created and modified using a software application called
Impromptu.
 Opening Impromptu
1.
From
the Start menu, choose Programs,
then MedSelect, then Examiner 6.0. The Impromptu application will open.
If
you have several MedSelect products on the same PC, you should browse for the
catalog directory and open the desired catalog, select the correct User Class
from the pull-down list and click on OK.
Opening an Examiner report
1.
From the File
menu, choose Open.
Choose the report you want from the appropriate folder. The list of
available Standard Reports can be found in Examiner Standard
Reports on page 10.
2.
Click Open. (Or double-click on the report name.)
For
some reports, you are prompted to enter a Date Range
for the report information. The date and
time convention used is YYYY-MM-DD (where Y=year, M=month, D=day); followed by
the time as 00:00:00.000 (for hour, minute, second, and hundredth of a second). The time portion of the prompt may be left
blank; it will default to midnight. Do
not delete the dashes or spaces. The
Begin Date/Time and End Date/Time will appear in the header
of your report, as will the date and time the report was generated.
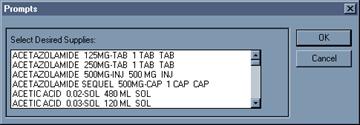
For
some reports, you will be prompted to select display terminal locations,
supplies, cabinet locations, etc. Click
on the desired prompt(s). If you want to
choose multiple prompts not in a series, click on each one while holding down
the CTRL key.
If you want to choose multiple prompts in a series, click on the first
prompt, then click on the last prompt while holding down the SHIFT
key.
3.
Click OK.
Note: If your completed report lists
events that do not have a required matching event (such as a Return event with
no original Taken event), then the Date
Range you specified may
be too limiting. You may want to
generate the report again with a broader Date Range.
Note: If you would like to change the Date Range
or any other report prompt while that report is open, from the Report
menu, choose Prompt (or click the Prompt
button).
___________________________________________________________________________
Printing an Examiner Report
To
print the report that you are viewing, under the File
menu, choose Print.
Scheduling
an Examiner Auto Reports
Auto
Reports can be scheduled to print automatically on a daily, weekly, or monthly
basis. The list of available Auto Reports is available in Examiner
Standard Reports on page 10.
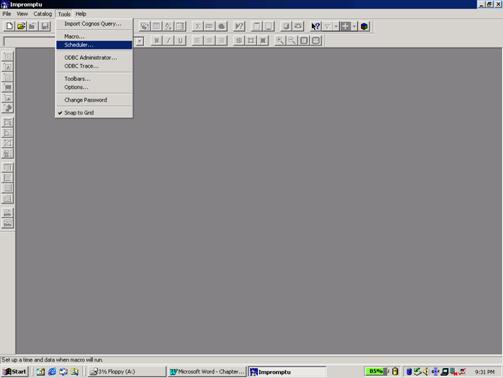
1.
Under
the Tools menu, select Scheduler.
2.
On the Scheduler window, select the Scheduled
index tab.
3.
Under the Insert menu, select Recurring
task if you want to schedule a report to print on
a regular cycle, or Task if you only want to schedule the report to
print once and only once.
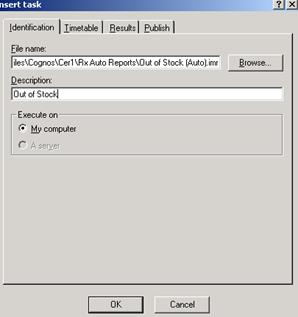
4.
On the Insert Task window, select the Identification
index tab.
5.
Click on the Browse
button.
6.
Browse to the path where the auto reports are
stored.
This
should be c (or d):\program files\cognos\cer1\Rx Auto Reports
OR…
c (or d):\program files\cognos\cer1\SS+ Auto Reports
7.
In the Files of type field,
select All Files.
8.
Select the proper file name, then click on the Open
button:
9.
The path and file name is inserted into the File name
field.
10. Enter
a description.
An
example of a description is Midnight Below Minimum Report.
11. Select
the Timetable index tab.
12. Set
the timetable options so that the report prints when you want it.
For
a recurring task, you can specify daily, weekly, or monthly, the time when you
want the report to print, and the Date
Range.
For
a single task, you can specify the date and time.
13. Select
the Results index tab.
The
results settings are used to indicate the output for this report. Select the Print
option if you want this report to be printed, then select the printer and the
number of copies.
If
you want this report to be sent to a file, select the File, Save As
option and then specify the path and filename.
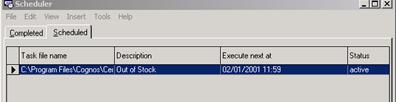
14. Click
on the OK button.
The
report is now listed in the Scheduler window.
15. Minimize
the Scheduler application, but do not
close Scheduler.
Scheduler
must be running for the report to print automatically. However, you can close the Impromptu
application if you wish. If Impromptu is
not running when it is time for the report to print, Scheduler automatically
launches Impromptu then opens and prints the report.
Examiner
Standard Reports
Rx
(MedSelect) Reports
For updated descriptions of Rx Reports,
please see the Readme file included with Examiner. To open the readme file, click on the Start button on the Windows Task Bar, select Programs, then select MedSelect, then select Examiner Reference 6.0, then Rx Examiner Readme.
|
Rx Auto Reports
|
|
|
|
Below Minimum (Auto)
|
No Prompts.
Lists all Supply Positions where the current quantity is below the
minimum quantity. If the Nearest
Expiration Date is past or if the Position is Failed, the fields will be
Mellow Yellow 4. A failed Position
will have '(F)' appended to the Supply Position Description.
|
|
Inventory
Returns and Retrieves (Auto)
|
No
Prompts. Corresponding Return and
Retrieves will be grouped together.
Retrieve Events that created a discrepancy will have '(D)' appended to
the Status Description and the Status Description will be Mellow Yellow 4.
|
|
Out
of Stock (Auto)
|
No
Prompts. Lists all Supply Positions
where the current quantity is zero. If
the Nearest Expiration Date is past or if the Position is Failed, the fields
will be Mellow Yellow 4. A failed
Position will have '(F)' appended to the Supply Position Description.
|
|
Restock
Cabinet (Auto)
|
No
Prompts. Lists all Supply Positions and the Quantity needed to stock each
position to its maximum. If the
Nearest Expiration Date is past or if the Position is Failed, the fields will
be Mellow Yellow 4. A failed Position
will have '(F)' appended to the Supply Position Description.
|
|
Restock
Summary (Auto)
|
No
Prompts. List all Stocking events that
have occurred. The Date Range
uses the report criteria filed entered at the AWS in the Facility
window. Discrepant events will be Mellow
Yellow 4 and the Status Description will have '(D)' appended to it.
|
|
Return
Drawer Contents (Auto)
|
No
Prompts. Lists contents of all Return
Drawers.
|
|
Yesterday’s
Usage (Auto)
|
No
Prompts. Schedule this report any time
after midnight to see all Usage events created from the previous day. Updated to include High Alert Med status. Sorted by User and Dispense Date. This report does not include the Taken
events that have a corresponding 100% return, 100% waste, or events that were
canceled. To view all events, delete
the following from the filter: “and Event Dispense Group < > 0”.
|
|
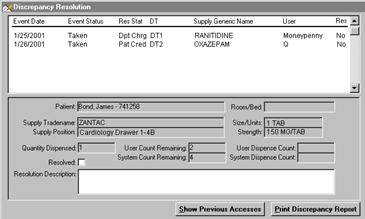
discrep.exe
|
This
report lists all unresolved
discrepancies reported by the system (discrepancies are differences between
the system count and a user’s reported count for a particular position). For
each discrepant position it also lists the users who recently had access to
the position.
When
you generate this report, information is printed based on the most recent
settings used on the Discrepancy Resolution window. These settings include
following options:
|
|
|
|
|
discrep.exe
(cont.)
|
·
Unresolved discrepancies are only shown for
dates specified using the Date
Range option. The report uses the last Date Range
specified.
·
The number of previous accesses shown is based
on the last setting used for the previous accesses option. The report uses whatever number was last
specified for the previous accesses.
This report is not an Examiner Report and
can run in Scheduler.
|
|
|
|
|
Rx Billing
|
|
|
Billing
(Auto)
Billing
|
No
Prompts. For 24 hour prior to run date
list charges and credits against patients.
For a
specified Date Range, lists changes and credits
against patients
|
|
|
|
Rx
Reports (Standard)
|
All Events by Location
|
Prompts for Display Terminal Location and desired Date Range. Lists all events, sorted by Dispense
Location and Supply Generic Name in ascending order and Event Date in
descending order.
|
|
All Events by Supply
|
Prompts for Supply Generic Name and desired Date Range. Lists all events, sorted by Supply Generic
Name in ascending order and Event Date in descending order. This could be helpful when resolving
discrepancies. Includes audit and
audit discrepancy events.
|
|
Audit Summary
|
Prompts for Display Terminal Locations and desired Date Range. Lists all system positions that have had inventory
events, including audit, for the specified Date Range
and selected Locations. Discrepant
events will be Mellow Yellow 4 and the Status Description will have '(D)'
appended to it.
|
|
Audit Summary - UDM Only
|
Prompts for Display Terminal Locations and desired Date Range. Lists all UDM positions that have had
inventory events, including audit, for the specified Date Range
and selected Locations. Discrepant
events will be Mellow Yellow 4 and the Status Description will have '(D)'
appended to it.
|
|
Available Positions
|
Prompts for Cabinet Locations. Lists existing positions that do not have
supplies assigned to them.
|
|
Controlled Substance Archive
|
Prompts for desired Date Range. Renamed from the Controlled Substance
Report. Lists all narcotic events back to three years. Updated to include audit and audit
discrepancy status.
|
|
Controlled Substance Graph by Location
|
Prompts for desired Date Range,
Dispensed Location and Supply Generic Name (DEA Schedules only). Dispensed Quantity Graph now in descending
order. There is a current known problem when the Legend becomes to large.
Impromptu 6.0.371.1 will give the following error, "IMPADMIN caused an
invalid page fault in module COGPG32.DLL at 014f:005ab91d." You must reboot your machine and may
attempt the report again with a smaller Date Range. A fix will be forwarded when
available. This Report can NOT go back
three years.
|
|
Controlled Substance Graph by Supply
|
Prompt for desired Date Range
and Supply Generic Name (DEA Schedules only).
Dispensed Quantity Graph is now in descending order. There is a
current known problem when the Legend becomes to large. Impromptu 6.0.371.1 will give the following
error,"IMPADMIN caused an invalid page fault in module COGPG32.DLL at
014f:005ab91d." You must reboot
your machine and may attempt the report again with a smaller Date Range. A fix will be forwarded when available.
This Report can NOT go back three years.
|
|
Database Supply Summary
|
No Prompts.
List all Supplies available in the Database. Sorted by Supply Generic Name in ascending
order.
|
|
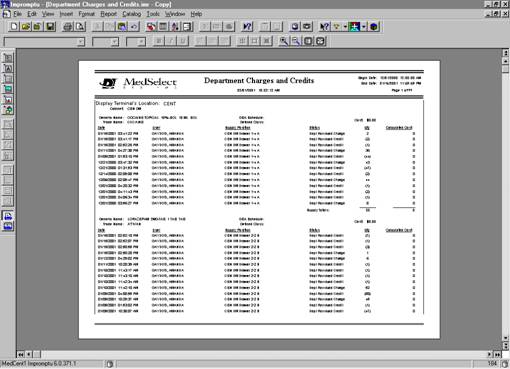
Department Charges and Credits
|
Prompts for desired Date Range. Lists all medications and other supplies
that were either charged or credited to a specific department because of an
inventory discrepancy. Updated to
include audit and audit discrepancy statuses. Sorted by Display Terminal
Location, Cabinet Description and Supply Generic Name in ascending order.
|
|
Discrepancy Tracking by UDM Positions
|
Prompts for desired Date Range
and DT Node Names. This report allows the user to look at discrepancies by
UDM position, to help in evaluating why discrepancies occur. This report can
be used to evaluate if discrepancies occur due to wrong size med in wrong
size coil/bin or coil/bin misfire.
Updated to include audit and audit discrepancy statuses.
|
|
Electronic Lock Cabinet Labels
|
Prompts for Cabinet Location. Prints labels for all Electronic
Locks. (Supply Cabinet and ELC's)
|
|
Event Summary
|
Prompts for Display Terminal Locations. This report separates events into scheduled
medications and non-scheduled medications.
Calculates a total of each status per location and a grand total of
all locations.
|
|
Event Tracking for Drawers, Doors & Locks
|
Cascading Prompts. First prompts for the DT's Node
Name, then for the desired Date
Range and Physical Position
(Drawer, Door, or Lock) that are associated with the DT Name selected in the
first prompt. Lists all events sorted in Ascending order by DT Name, Cabinet
Name, Lock Position (Physical Position) and (if selected) Return Drawer first
then Retrieve Drawer than the rest of the Positions. Use this report to view
ALL USER access to a door or drawer with multiple supplies assigned, i.e.
Supply Cabinets, Refrigerator Lock, etc.
|
|
Inventory Returns and Retrieves
|
Prompts for desired Date Range. Return events and their associated
Retrieves will be grouped together.
Retrieve events that created a discrepancy will have the '(D)'
appended to the Status Description and the Status Description will be Mellow
Yellow 4.
|
|
Inventory Summary
|
Prompts for Cabinet Locations. Lists all supplies actually stocked in the
system, sorted by Location, then Cabinet.
Nearest Expiration Date will be Mellow Yellow 4 if it is past.
|
|
Location Usage
|
Prompts for desired Date Range
and Display Terminal Locations. Lists
Usage events by Location. Events that
created a discrepancy will have the '(D)' appended to the Status Description
and the Status Description will be Mellow Yellow 4. REMEMBER - PRN's will not have a Prescribed
Date.
|
|
Medication Expiration Date
|
Prompts for Cabinet Locations and Greatest Expiration
Date. Lists all positions in the
system that contain an expiration date that is less then the Greatest
expiration date entered in the Prompt.
Expiration Dates that are past will be Mellow Yellow 4. To filter on Supplies that do not have a
Nearest Expiration Date, click on the blank area where the Nearest Expiration
date should be and then click on the picture of the funnel on the tool
bar.
|
|
Patient Detail
|
Prompts for Patient Visit's Created by AWS, Display
Terminal or Interface. Sorted by
Patient Last Name in ascending order.
|
|
Patient Usage
|
Prompts for Patient ID Number, then desired Date Range
and Patient Visits. Updated to include
High Alert Med status. To filter on events that were not
dispensed via the MedOrder Screen, click on the blank area where the MedOrder
# should be and then click on the picture of the funnel on the tool bar.
REMEMBER - PRN's will not have a Prescribed Date.
|
|
Physician Usage
|
Prompts for desired Date Range
and Physician Names. List all usage
events dispensed via a MedOrder and all usage events with an associated
physician from the Picklist. Updated
to include High Alert Med status. REMEMBER - PRN's will not have a Prescribed
Date.
|
|
Random Staff Usage of Controlled Substances
|
Cascading Prompts. You are first prompted for the DT
Name's and then the # of Days to Retrieve a Staff List (This will shorten
your Staff Usage Picklist to only those who have created events in the # of
Days entered for DT's selected). The
second prompt has your filtered Staff Name list and also prompts for the
# of Days from today for the Staff
Usage (will include ALL usage
regardless of the DT's selected in the first prompt). Displays the Dose Ordered for
MedOrders. Updated to include High
Alert Med status.
|
|
Restock Cabinet
|
Prompts for Cabinet Locations. Lists ALL positions in the system, and the
quantity of the supply that must be added to restore the position to its
maximum. If the Current Quantity is Below Minimum, or the Nearest Expiration
Date is past or if the Position is Failed, the fields will be Mellow Yellow
4. A failed Position will have '(F)'
appended to the Supply Position Description.
|
|
Restock Selection
|
No Prompts.
Lists all counted positions that need to be restocked, sorted by
pharmacy location in ascending order.
|
|
Restock Summary
|
Prompts for Display Terminal Locations and desired Date Range. Lists all system positions that have been
restocked for the specified Date
Range and selected
Locations. Discrepant events will be
Mellow Yellow 4 and the Status Description will have '(D)' appended to it.
|
|
Staff Access Rights by Dept.
|
Prompts for Desired Department. Lists users and their access right by the
selected Department. Warning: If all users are assigned to all departments,
this report will be very large.
|
|
Staff Access Rights
|
Prompts for desired Staff Names. Lists all system users and their assigned
access rights.
|
|
Staff Usage
|
Prompts for desired Date Range
and Staff Names. Lists all selected
users and the supplies associated with non-stocking events. This report also includes Centrack
events. Updated to include High Alert
Med status. Discrepant events will be
Mellow Yellow 4 and the Status Description will have '(D)' appended to
it. To filter on events that were not
dispensed via the MedOrder Screen, click on the blank area where the MedOrder
# should be and then click on the picture of the funnel on the tool bar. REMEMBER - PRN's will not have a Prescribed
Date.
|
|
Supply Usage
|
Prompts for desired Date Range
and Supply by Generic Name. List all
dispenses for selected supplies from within Date Range.
Updated to include High Alert Med status. Sorted by Supply Generic Name in ascending
order and Event Date in descending order.
Each event has a supply cost and there is a Total Cost per Supply. REMEMBER - PRN's will not have a Prescribed
Date.
|
|
System Configuration
|
Prompts for Cabinet Location. Shows detailed configuration of your
MedSelect system. Useful during
initial Setup.
|
|
System Log Messages
|
Prompts for desired Date Range. Sorted by Application and Event Date in
ascending order
|
|
System Position Labels
|
Prompts for Cabinet Locations. Sorted by Cabinet Location, Cabinet
Description, and Position Description in ascending order.
|
|
Unexpected Hardware Activity
|
Prompts for desired Date Range
and Display Terminal Locations. Lists
intrusion alerts, position description, user (if exists), and date of
occurrence, grouped by DT.
|
|
Velocity Report by Location
|
Prompts for desired Date Range
and Display Terminal Locations. A
position will appear more than once if it has had a new supply assigned to
it.
|
|
Velocity Report by Supply
|
Prompts for desired Date Range
and Supply Generic Name. Lists all
supplies that have been dispensed during the selected Date Range. Computes the Average, Minimum and Maximum
Quantity Dispensed per Event and the Total number of Supplies and Total
Number of Events per Supply.
|
|
Wasted Medication
|
Prompts desired Date Range
and Display Terminal's Location. List
all wasted events sorted by User Name in ascending order and Event Date in
descending order.
|
Rx MedOrder Reports (these
reports only available with a MedOrder system)
|
MedOrder Give Schedules
|
No Prompts. Lists all MedOrders and their Give Status'
for the past 24 hours.
|
|
MedOrder Information
|
Prompts for MedOrder Status, MedOrder Earliest and
Latest Stop Date, and Patient Visit Status.
Shows MedOrder Information only.
Could be used to determine which MedOrders are about to be Stopped.
|
|
|
|
|
|
|
|
|
|
|
|
|
|
MedOrder Sig Codes
|
No Prompts.
Lists all Sig Codes in the Database.
Sorted in ascending order by Sig Code.
To change the sort: Select the Report, Query and then click on the
Sort Tab.
|
For updated descriptions of Centrack Reports, please see the
Readme file included with Examiner. To
open the readme file, click on the Start
button on the Windows Task Bar, select Programs,
then select MedSelect, then select
Examiner Reference 6.0, then Centrack Examiner Readme.
Centrack Auto Reports
See page 8
for instructions on scheduling auto reports.
Centrack Events
by Supply (Auto)
|
This report lists
all Centrack Events and is sorted by Generic Name and Event Date in ascending
order. Schedule this report after
midnight to see all events from the previous day.
|
Centrack Reports (Standard)
|
Borrow, Loan and Sell
|
For a specified Date Range,
this report will show all the Borrow events and their corresponding Return
Borrow events, the Loan events and their corresponding Return Loan events,
and all the Sell events. Also, all events that are in-transit (they do not
have their corresponding return event) will be included and the return
quantity, return date, and return pharmacist for these events will be blank.
This Report Should NOT be altered.
|
|
Centrack Audit Events
|
For a specified date range, this report will show all
supplies that have been audited.
|
|
Centrack Below Minimum
|
This report will retrieve all supply positions within
the pharmacy, where the position's current quantity is less than the
position's minimum quantity. For each
supply position, a calculated restock quantity will be provided to fill the
position to its maximum quantity.
|
|
Centrack Database Supply Summary
|
This report lists all supplies in the database that
have been assigned to a Centrack position.
|
|
Centrack Deposits
|
For a specified date range and selected Centrack User
this report lists all medications Deposited (or Returned) into the pharmacy.
The report can be filtered for a specific pharmacist. There will be a footer
for every supply with the Generic Name and the total number of Deposits for
that supply.
|
|
Centrack Events by Supply
|
For a specified date range and selected Centrack
Supplies this report lists all Centrack generated Events.
|
|
Centrack Inventory Summary (DEA 2 Sort)
|
Lists all Centrack Supplies and where they are located
in the Vault. The report is grouped by DEA 2's. Then the DEA 2's are
alphabetical by Generic Name in ascending order, and all other DEA Schedules
follow alphabetically by Generic Name in ascending order.
|
|
Centrack Inventory Summary
|
Lists all Centrack Supplies and where they are located
in the Vault. The report is sorted by Supply Position Description.
|
|
Centrack Supply Tracking
|
For a specified date range and selected Centrack
supplies, this report lists Centrack events and their corresponding Stock or
Unload events. Expires are not currently included.
|
|
Compounds
|
Prints out all Withdraw Ingredient events for
Compounding and the Compounds that were created for a specified time frame.
This report can be used to verify that the correct number of compounds were
created, (including wastes) in the vault. This report should NOT be altered.
|
|
Controlled Substance Inventory Summary
|
Prompts for cabinet location and DEA Schedule. There
will be a footer for every supply with a total number of supplies for
Locations selected. To print only the footer with the total summary, delete
each column.
|
|
DT Withdraws
|
This report lists all supplies that have been
Withdrawn from the vault and have not yet been Stocked to a Display Terminal.
|
|
Expired In-Transit Supplies
|
This report lists all events that are In-Transit and
were Expired, Unloaded and Quarantined.
|
|
In-Transit
|
This report lists all events that are waiting to be
Stocked to a Display Terminal, Returned to the Pharmacy, Quarantined or
Wasted, etc. Note: Excludes paper tracking Withdraws.
|
|
Paper Tracking
|
This report lists all paper tracking transactions that
have not been completed. A paper
tracking transaction is a Withdraw event that is not Withdrawn to be restocked
in a Display Terminal.
|
|
Quarantine
|
Similar to DEA Form 41, this report shows all
medications that have been Quarantined and are waiting to be
Surrendered. Page breaks separate
package numbers.
|
|
Unit Package
|
Prints out all medications that were Withdrawn for
Unit Packaging (Withdraw Bulk), and the associated Waste PH and resulting
Deposit UnitPkg. that were created, for a specified time frame. This report can be used to verify that all
Unit Packages have been accounted for (including Wastes) in the vault. This report should NOT be altered.
|
For updated descriptions of SupplySource Reports, please see
the Readme file included with Examiner.
To open the readme file, click on the Start
button on the Windows Task Bar, select Programs,
then select MedSelect, then select
Examiner Reference 6.0, then SS+ Examiner Readme.
SS+ Auto Reports
See page 8
for instructions on scheduling auto reports.
SS+ Refill Event
Summary Last 7 Days (Auto)
|
No Prompt. This report lists all expires, stocked and
unload events for the last 7 days
|
SS+ Billing
|
|
SS+ Billing
(Auto)
|
For 24 hours prior to run date, lists charges
and credits against patients.
|
SS+ Billing
|
For a specified Date Range,
lists charges and credits against patients.
|
SS+ Reports (Standard)
|
SS+ Audit Worksheet
|
For selected Locations this report may be used as a
worksheet when checking stocked quantities.
|
|
SS+ Available Positions
|
For selected Locations, lists all Tower positions that
are available to have supplies assigned to them.
|
|
SS+ Configuration
|
Lists Controller information.
|
|
SS+ Day of the Week Total Usage
|
For a specified Date Range
lists the total usage for a supply per day and the total usage for a supply
for the entire date range.
|
|
SS+ Day of the Week Average Usage
|
For a specified Date Range,
lists the Average dispenses for all Mondays, Tuesdays, Wednesdays, Thursdays,
Fridays, Saturdays and Sundays.
|
|
SS+ Department Charges and Credits
|
For a specified Date Range,
lists all charges and credits. After
an Audit of a Location this report will show lost charges.
|
|
SS+ Location Dollar Value
|
For selected Locations, lists the total current dollar
value of a supply by position and the total maximum dollar value of that
position.
|
|
SS+ Nursing Inventory
|
For selected Locations lists all stocked inventory and
their current position quantity.
|
|
SS+ Patients Detail
|
Lists Patients with open or on-hold visits, prompt for
Visits Created by: AWS, DT, Interface or Control Center.
|
|
SS+ Patient Usage
|
For a specified Date Range
lists all patients and their dispensed events. Also lists the Total Supply Cost per event
and Total Patient Cost for the specified date range.
|
|
SS+ Supply Position Labels
|
For selected Locations Prints Labels for all Tower
Positions and the supplies stocked in that position.
|
|
SS+ Refill Event Summary
|
For selected Locations and specified Date Range,
lists all Stocking events, Total Quantity per Supply, Supply Cost per Event,
Supply Cost per Tower and Supply Cost per Location.
|
|
SS+ Refill Positions Below Minimum
|
For selected Locations, lists all Supply Positions
that are below their Minimum. Has the
quantity needed to refill the Position to it's maximum. Or the Stock-It Quantity if Stock-It at the
Display Terminal is going to be used.
|
|
SS+ Refill Position Stock Outs
|
Lists all Supply Positions that are Out of Stock. Has the quantity needed to refill the
Position to it's maximum. Or the
Stock-It Quantity if Stock-It at the Display Terminal is going to be used.
|
|
SS+ Refill Position to Maximum
|
For selected Locations, lists all Supply
Positions. Has the quantity needed to
refill the Position to it's maximum.
Or the Stock-It Quantity if Stock-It at the Display Terminal is going
to be used.
|
|
SS+ Staff Access Rights
|
For selected SupplySource Users, lists the Users and
all of their access rights.
|
|
SS+ Staff Usage by Location
|
For selected Date Range
and SupplySource Users, lists their Usage and the Total Usage Quantity per
Supply, Total Cost per Event, Total Supply Cost per Supply and Total User
Cost.
|
|
SS+ Staff Usage by Supply Graph
|
For selected Date Range
and SupplySource Plus Supplies, shows the total User Usage in Graph form.
|
|
SS+ Supply Expiration Date
|
For selected Locations and Greatest Expiration Date,
lists all supplies about to expire or that have already expired.
|
|
SS+ Supply List
|
Lists all SupplySource Supplies and some Detailed
Information.
|
|
SS+ Supply Usage by Location Graph
|
For selected Location and specified Date Range,
displays Supplies and their total usage in Graph form.
|
|
SS+ Supply Usage by Location
|
For a specified Date Range,
selected Locations and selected SupplySource Supply, lists all usage by
location. It also lists Event Total
Cost, Total Quantity per Nursing Name, Total Supply Cost per Nursing Name and
Total Location Cost.
|
|
SS+ Supply Usage by Material Name
|
For a specified Date Range,
selected Locations and selected SupplySource Supply, lists all usage by
Material Name and then Location. It
also lists Event Total Cost, Total Quantity per Material Name and Location,
Total Supply Cost per Material Name and Location, Total Quantity per Material
Name (all Locations) and Total Supply Cost per Material Name (all Locations).
|
|
SS+ System Log Messages
|
For a specified Date
Range, prints Log messages.(i.e.
logging in to the Control
Center or SS+ DT)
|
MedSelect offers one other standard report that is not
available from within Examiner. It can
only be accessed from within the application (AWS, Centrack, or Control Center) or scheduled as an auto
report. The Discrepancy Report has an
.EXE File Extension not an IMR Extension.
The file name is Discrep.exe.
To print the Discrepancy Report
1.
In the AWS and Control Center,
from the Management menu, select Discrepancy Resolution.
In Centrack, from the Tools
menu, select Audit, and then select
Discrepancy Resolution.
The Discrepancy Resolution window is displayed.
2.
Enter a Date Range.
3.
Select the Print
Discrepancy Report button.

To schedule the Discrepancy Report as an auto report, see
page 8.
All standard and auto reports can be found in the C: (or D:)\Program Files\Cognos\Cer1
folder. You will see the folders for only the product(s) you have installed.
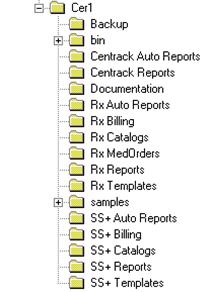
There are two catalogs in the Rx Catalogs directory,
Medview2.cat and Test2.cat. Medview2.cat
will connect the user to the production database and Test2.cat will connect the
user to the test database. These
catalogs are used for the Rx MedSelect and Centrack applications. When opening a report, if a catalog has not
yet been opened, Impromptu will default to the last catalog that the report you
chose was connected to. To select your
catalog option before opening a report, do the following:
To select a desired Rx Catalog
1.
From the Catalog
menu, choose Open.
2.
To connect to the production database select Medview2.cat
OR
To connect to the
test database select Test2.cat.
(If you do not
see these options, browse for the Rx Catalogs directory)
3.
Click Open.
4.
The Catalog Login box opens.
·
To run Rx MedSelect Reports or MedOrder Reports
the User Class is MedSelect
·
To run Centrack Reports, the User Class is Centrack
Note: A user logged on as User Class MedSelect will
not see any data on Centrack Reports, but a user logged on as Centrack will see
data on Rx MedSelect and MedOrder Reports as well as the Centrack Reports.
There are two catalogs in the SS+
Catalog directory, SupplySource.cat and Test SS+.cat. SupplySource.cat will connect the user to the
SupplySource production database and Test SS+.cat will connect the user to the
SupplySource test database. These
catalogs are used for the SupplySource Product.
When opening a report, if a catalog has not yet been opened, Impromptu
will default to the last catalog that the report you chose was connected
to. To select your catalog option before
opening a report, do the following.
To select desired SupplySource Catalog
1.
From the Catalog
menu, choose Open.
2.
To connect to the production database select SupplySource.cat
OR
to connect to the
test database select Test SS+.cat.
(If you do not see these options, browse for
the SS+ Catalogs directory)
3.
Click Open.
4.
The Catalog Login box opens.
·
To run SupplySource Reports the User Class is SupplySource Plus.
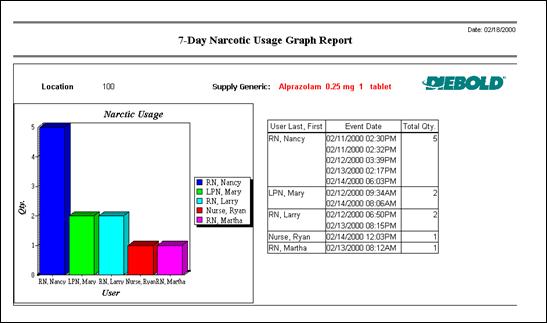
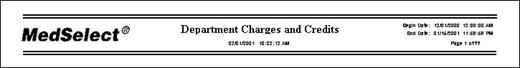
The report header contains important information about your
report. Some headers may appear as shown in the bottom graphic.
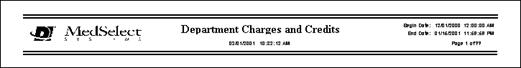
If you were prompted to enter a date range when opening the
report, the begin and end dates are displayed in the upper right corner of the
report.
The date and time the report was generated displays under the
name of the report.
The page number will display in the lower right corner of the
Header. The total number of pages will
be noted with question marks, e.g., Page
1 of ??. This occurs because the report has not yet been paginated. If you would like to know how many pages are
in the report before printing it, click the Print
Preview button on the Standard toolbar. When you print the report, it will paginate
and the proper page number information will be on the report.
Examiner reports have been meticulously created with the
input of pharmacy personnel and supply managers. Many of the Standard reports (see page 10
for a complete list) should serve your needs with little modification. Please explore the entire list of standard
reports before deciding to modify a standard report, or create a custom report.
If you decide that you simply need to modify an existing
standard report, this chapter will aid you in learning how to “tweak” reports
by hiding data, adding a data field, etc.
For information about creating custom reports, see Chapter 3.
All modified standard reports must be saved to a separate
“custom report” directory. This will
prevent your modified reports from being deleted during routine software
upgrades of MedSelect products.
To create a custom report directory
1.
Open Windows Explorer.
2.
Click on the C:
(or D:) drive.
3.
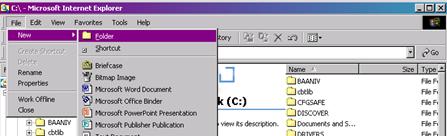
From the File
menu, select New, then select Folder.
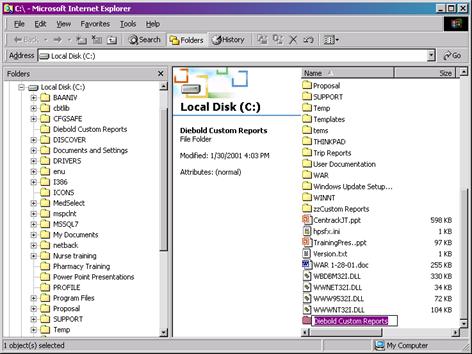
4.
Name this folder Custom Reports.
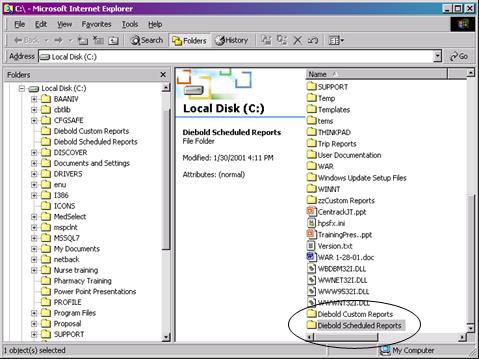
If you have more than one software
application running on this PC (e.g., the AWS and Centrack), you may want to
create a folder for each, for example: Rx Custom
Reports and Centrack
Custom Reports.
5.
Close Windows Explorer.
By saving your report you will save
the format of the current
report. The data displayed on the report does not get saved.
Saving of customized reports should
always be at the Custom Report Directory created above.
Impromptu has designed a window into the database that allows
you to view and build queries against the data elements, while insulating you
from the complexities of the MedSelect database. The complexities of the database occur
because of the way in which certain data elements are joined together. Logical groupings of data elements have been
assembled to insure that your customized reports function properly. The objects
used to display these logical groupings are folders.
Folders are
meaningful groupings of information and are broken down into logical subsets,
each containing data from numerous MedSelect database tables.
To open a folder, double click on the
folder name.
All the
associated data items are displayed. A
folder can have subfolders. The
subfolder is a logical grouping within its parent folder. If a folder has subfolders, the folder icon
has a plus sign, which means it can be expanded.
To determine what folder the
desired data is located in when creating a custom report, determine what type
of information is needed in general terms.
Search and find folders that would logically have that information. Open the folder(s) and verify the data needed
is contained in that folder(s). Some
data items have been duplicated between folders so that all data items needed
for a report may easily be found.
All the Examiner standard reports
use grouping to organize data in an understandable manner. Often, the grouping is on a calculated field
that is complex. Therefore, it is
recommended that users make no changes to the existing grouping of the Examiner
standard reports.
When customizing a standard
Examiner report, the only recommended change to the sorting is to change from
ascending to descending or visa versa.
Additional sorts are not recommended.
Any data elements added to or
previously existing within the report may be filtered, as long as the rules for
modifying data items of standard reports have been adhered to (see Modifying Data Items at the beginning of
this chapter). For a detailed
explanation of filtering see Chapter 4.
Existing calculations should not be
modified. Additional calculations can be
created and added to standard reports.
Exception: Do not add, remove, or
modify calculations from the Discrepancy
Report, the Velocity Report (by
Location), or the Velocity Report by
Supply. For a detailed explanation
of calculations see Chapter 3.
A template is a pattern you can use
to build reports. Using templates to
create new reports can save you time and effort. Examiner offers several templates to aid in
the creation of reports.
To begin the creation of a new
custom report, from the File
menu, select New.
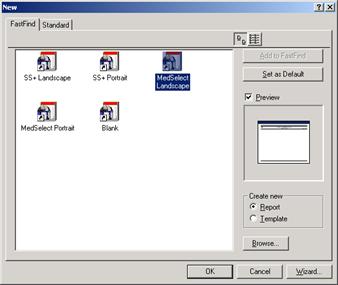
The New dialog box is displayed with the selection of
templates from which to choose.
On the “Fastfind” tab templates listed as shown below:
MedSelect: By choosing this template, your report will have
the same header as the standard MedSelect reports.
Blank: This template is best when multiple frames are to be
combined for a report.
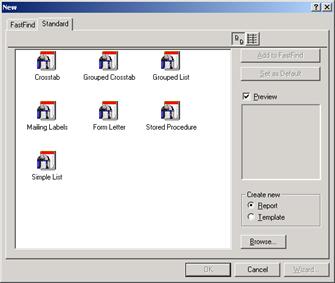
On the “Standard” tab templates listed as shown
below:
Crosstab: This
template creates a crosstab report that shows summary information from a list
report in a compact table of rows and columns. A crosstab shows the value for
the intersection point of each row and column.
Grouped Crosstab: This
template is similar to the crosstab but also groups the data.
Grouped List: This template is similar to a simple list but
also groups the data.
Mailing Labels: This
template is used to create mailing lists.
Form Letter: This
template creates a letter using data items from the database, such as patient
name and address. The addressee lines
are completed with the data items and then there is a free text area for the
body of the letter.
Stored Procedure: Used for complicated multi-report formats
Simple List: This
template creates a report that lists data items in columns and rows. The result looks similar to a spreadsheet.
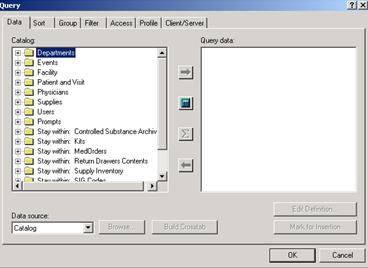
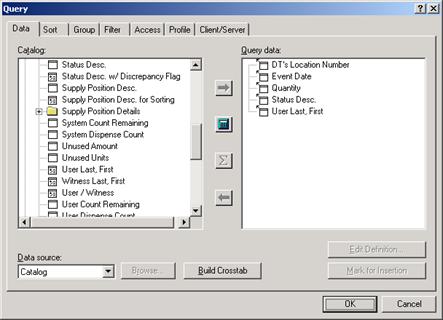
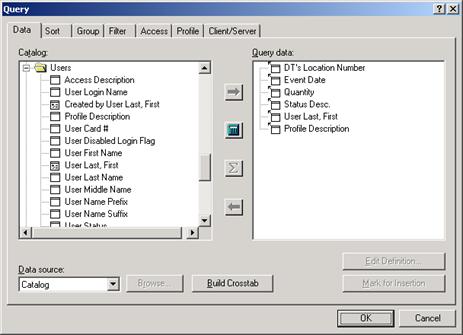
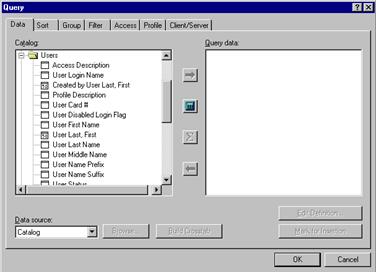
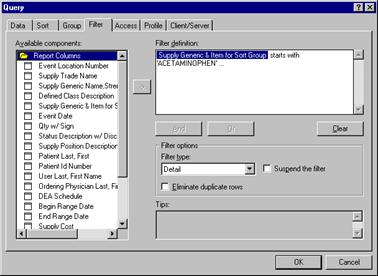
The Query dialog box is the integral
part of the Impromptu product. This
dialog box has seven (7) different tabs:
1.
Data: Allows for the insertion and deletion of
information to be displayed on a report.
The Data window has the following components:
·
Catalog list box
·
Query Data list box
·
Various buttons
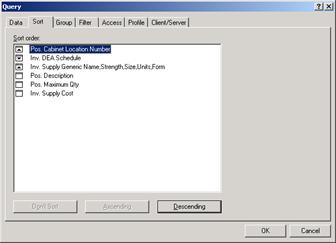
2.
Sort: Allows data on a report to be sorted in
various combinations. The sort window
consists of:
·
Sort
Order: A box for specification of the
sort order of the selected data items
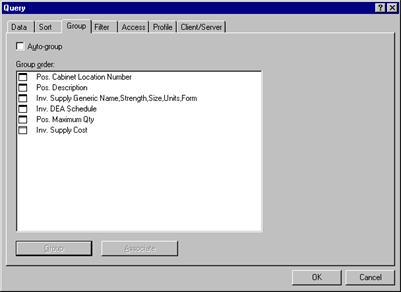
3.
Group: Allows for grouping of data to improve the
readability of a report. The group
window consists of:
·
Group
Order: A box for specification of the
group order of the selected data items
4.
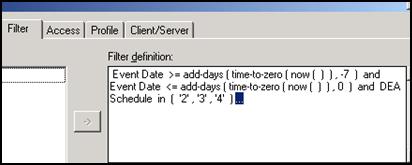
Filter: Provides the ability to display only data
that meets the specified criteria.
·
Available
filter component box
·
Filter
definition box
5.
Access: Determines how data is accessed.
6.
Profile: Shows detailed information about the query.
7.
Client/Server: Sets the type of query processing.
Within the Data tab of the Query
dialog box is the Catalog list box. The
Catalog list box displays folders of common data. The folders must be opened to view the data
items.
To
open a folder and view the data items:
·
Double-click on the desired folder
Data items can be added to the Query Data list box by:
·
Double clicking on the data item
OR…
·
Clicking once on the data item, then clicking on
the Add button  .
.
Removing a data item from the Query
Data list box can easily be accomplished.
 To
remove an item:
To
remove an item:
·
Select the data item to be removed
·
Click on the Remove
button  .
.
Note: Data may be
used from multiple folders ONLY if the folders are not Stay Within folders.
___________________________________________________________________________
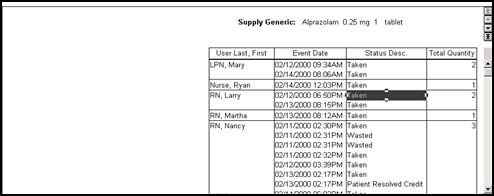
Grouping lets you arrange your data
into logical chunks of information. For
example, you may want to group data by user name so that you can easily view
the usage for each nurse.
When you group on a data item, the
following occurs:
·
All data within the group is sorted in ascending
order.
·
A break occurs each time a new data value
begins.
·
The value that the data is sorted on is printed
once within each grouped segment.
·
Grouping data causes some automatic sorting.
To
select data items for grouping from within the Group Query dialog box:
1.
Select the data item.
2.
Click on the Group
button.
The order of the grouped items
determines the order in which grouping is executed in the query.
Grouped items are identified by a
black bar across the top of the data item icon.
In the following example the first five (5) data items are grouped:

Grouping can also be done from the
report screen. To group a particular
column of information:
·
Select any data item in the column to be grouped on.
·
Click on the Group
button  found on the Standard Toolbar.
Note: It is more efficient to group data
items from the data query window. If
data is first retrieved for a report and then grouping is applied, the query
must be re-executed. This increases
Examiner’s query time.
Associating data items link them
together for grouping purposes. By
associating two data items together, the second item will be grouped according
to the first data item. Associating a
data item will cause it to display as a single value only at the beginning of
an associated grouped column. This
eliminates redundant information and makes your report more readable.
Associated data items must have a
one-to-one relationship to each other.
An example of a one-to-one relationship between data items would be
Supply Generic Name and DEA Schedule. A
particular Event’s Supply Generic Name would always be associated with a specific
DEA Schedule.
To
associate a data item:
1.
Select the data item within the group tab of the query
dialog box.
2.
Click on the Associate
button.
An associated data item has half of
a black bar across the top of the data item icon.
Sorting allows you to organize your
data alphabetically, numerically, or by date.
A report can be sorted on a single data column, or on multiple data
columns. The order in which you select the items to be sorted determines the
sort order.
For instance, you may want to sort
your Supply Generic Names in ascending alphabetical order for easy reference.
To
sort in ascending order:
1.
Select the data item.
2.
Click the Ascending
button.
To
sort in the descending order:
1.
Select the data item.
2.
Click on the Descending
button.
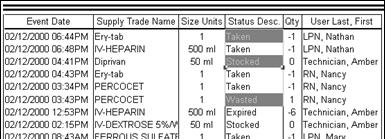
You can tell that certain items are
sorted in the query below because ascending or descending sort arrows appear
next to the data description.
To
remove sorting from a data item:
1.
Select
the data item.
2.
Click
on the Don’t Sort button.
Sorting
can also be done from the report screen.
To sort a particular column of information:
1.
Select any data item in the column to be sorted on.
2.
Click on the Sort
Ascending button  .
.
OR…
3.
Click on the Sort Descending button  .
.
___________________________________________________________________________
Note: Group data
items before sorting the data items.
___________________________________________________________________________
Calculations can be added to the
Query Data list and displayed on the report.
The Calculation Expression Editor is used to create calculations.
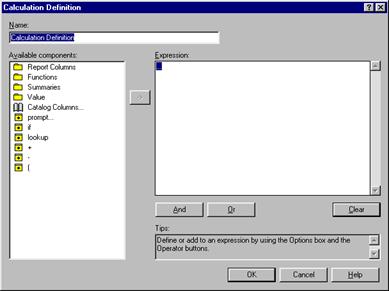
Impromptu has an Expression Editor
to assist in building calculations. The
Expression Editor is used to create and edit calculations. The main components of the Expression Editor
are:
·
Name text field:
the name of the calculation
·
Available components: the available options from which to choose
when creating/editing a calculation
·
Expression text box: the expression in its current state
·
The tips text box: context-sensitive help aids in creating a
valid expression
·
Buttons:
?
And/Or conjunction buttons
?
Clear removes the current expression in the
Expression text box
?
OK saves changes to the calculation
?
Cancel exits the Expression Editor without
saving changes
?
Help provides on-line help
A calculation combines operators, constants, functions, report
columns, and other components to compute a new data item based on existing data
items. As a result, calculations can
derive information that is not directly available from the data in the
database.
By using calculations, you can do
the following:
·
Combine existing data items in a report with
operators to create new data items. For
example, multiplying Supply Cost by Quantity to find the Total Cost.
·
Use value constants to define specific
components. For example, combine supply
size with supply size units to make a data item supply size/units.
·
Use functions to re-format data items. For example, applying mixed case to all
patient last names.
·
Use summaries to calculate total costs for each
medication or average costs of medications in cabinets.
·
Use conditional expressions that define specific
conditions for a new data item. For
example, insert the full state name (such as New York) if a data item only shows an
abbreviation (such as NY).
Filtering enables
you to retrieve a specific subset of records for your report. This means that you can filter out
unnecessary data and highlight the most important information in your report.
The easiest way of creating a
filter is to do it right from the report display.
To
filter data:
1.
 Select
one or more data items from your report on which to filter. To select multiple data items from the same
column, hold down the Ctrl key and select the values.
Select
one or more data items from your report on which to filter. To select multiple data items from the same
column, hold down the Ctrl key and select the values.
2.
On the Toolbar, click on the Filter
button  .
.
When selecting the Filter button,
Impromptu will re-retrieve only the data based on the values selected. By filtering out data that is not of
interest, the report becomes more meaningful and useful.
 Filtering
can also be done by selecting a data item and clicking on the down arrow next
to the filter button, select “in”, at this window you can choose one or more
values.
Filtering
can also be done by selecting a data item and clicking on the down arrow next
to the filter button, select “in”, at this window you can choose one or more
values.
The above filtering method is
executed after data has already been retrieved.
Depending on the amount of extraneous information in the report, the
content of this data may take longer to process. Extraneous data can also make the report less
usable.
To improve the efficiency of
database processing, create the filter prior to retrieval of data from the
database. Filters can be built into the
initial query using the Filter tab in the Query dialog box. By building the filter into the initial query,
the database is saved from that second hit.
The
Expression Editor is used to define filters.
To access the Expression Editor for filtering:
1.
From the Report
menu, select Query.
2.
Select the Filter
tab option.
OR…
Hold down the Ctrl
key while clicking the Filter
button  .
.


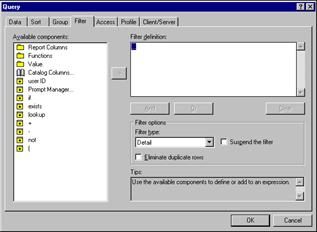
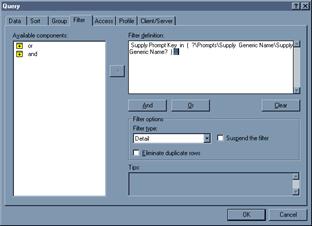
The Expression Editor for filtering
contains several components:
·
Available
components: Only the components that
create a logical expression are displayed.
·
Filter
definition (expression) text box:
This text box displays the filter expression as it is being created.
·
Filter
options: Special filter options such
as filtering by data or by summary data items.
·
Tips: Context sensitive tips are displayed as the
filter expression is being created. This
box is helpful when you are uncertain of what to do next or the filter
expression is not syntactically correct.
To
filter using data items in the Report:
1.
To display the data items included in a report, double
click on the Report Columns folder.
Example:
To view events that occurred for the
Supply Generic Name “Acetaminophen” your Filter expression should look like
this:
Functions are pre-defined
calculations that take one or more values, perform an operation, and return a
result. Functions provide an easy way to
perform complex data manipulations within calculations.
There are three (3) main types of
functions:
1.
Numeric functions:
perform mathematical or statistical calculations on numeric data
2.
String functions:
perform operations on character data (strings)
3.
Date functions:
perform operations on date fields, which includes dates, date-time, or
date intervals
Note: Be careful to match the data types to those
expected by the function.
The Tips box is especially useful when using functions. If additional information is needed about a
function, select the function. The Tips
box displays the syntax and an explanation of what the function does.
Calculating Date Intervals using Functions
Hospitals are often interested in
reports that cover a certain period of time.
For example, viewing usage for certain types of medications for the past
week or month.
There are two sources for date
data:
·
Date fields in the database, such as event date.
·
The system date of the computer.
The Now () function can be used to
reference the system date and time of the computer that contains the MedSelect
database. This creates a point in time
that is continuous and automatically updated.
Assume the only events desired on a
report are the last 24 hours of events.
Utilizing the Now() function makes this expression simple to create.
This expression uses two
functions: add-days and now() The syntax
for add-days is
add-days
(date_exp, integer_exp)
indicating that the add-days
function consists of two parameters.
·
The first parameter, date_exp, needs a date
expression. In this example, the now( )
function was used.
·
The second parameter, integer_exp, needs an
integer value. Since this function
calculates ‘yesterday’ from current date, the integer value used was –1.
These are constants that can be
used in filter expressions.
·
Predefined conditions are created by the
Impromptu Administrator and stored in the catalog.
·
You can use these predefined conditions to:
1.
Create a filter containing only the predefined
condition.
2.
Create a more complex filter expression by combining
the predefined condition with other conditions.
Catalog conditions, are predefined conditions as they are
sometimes called, are added to a filter definition in the filter expression
editor.
To
add a predefined condition to your report:
1.
Double click Catalog
Columns in the Available components list.
2.
Locate the condition that you want to include in the
filter expression.
3.
Double click it to add it to the filter expression.
Because predefined
conditions are also valid filter expressions, they can be used as the complete
filter expression. They can also be part
of a larger filter expression in conjunction with the logical operators and and or.
Predefined prompts are created by the Impromptu Administrator
and stored in the catalog.
To
add a predefined prompt to your report:
1.
Double click on Catalog
Columns in the available components list.
2.
Locate the Prompts
folder and desired catalog prompt.
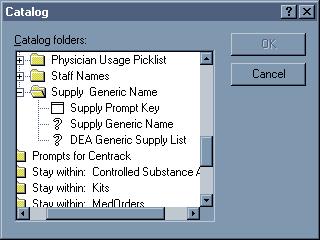
To
prompt for the Supply Generic Name:
1.
Double click on Supply
Prompt Key.
2.
Under Available
components:
3.
Select the “in”
operator.
4.
Double click on the open parenthesis ( .
5.
Double click on Catalog
Columns.
6.
Locate the Prompts
folder.
7.
Open the Supply
Generic Name folder.
8.
To include all Supply
Generic Name double click on Supply
Generic Name.
OR
9.
To include Schedules
supplies only, double click on DEA
Generic Supply List.
10.
Double click on the closed parenthesis ) .
The filter expression looks as follows:
The resulting prompt:
Catalog defined prompts cannot be
edited.
A prompt is a dialog that appears
when you open a report. It assists in
filtering the report. Prompts can be
report specific. A single prompt cannot
be used in two different reports.
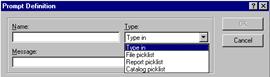
There are four types of prompts:
The Type drop down list within the Prompt Definition dialog box displays
four options from which to choose.
1.
Type in
2.
File picklist
3.
Report picklist
4.
Catalog picklist
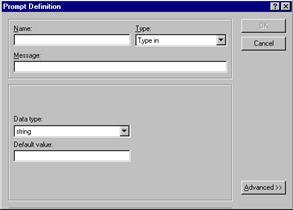
A type-in prompt appears when you
open or run a report. You have to type
in one or more values (numeric or character strings) that tell Examiner how to
filter the report. Examiner is
case-sensitive and retrieves information that exactly matches the value
entered.
Type-in prompts are often used to
enter start and end points for:
·
Data filters
Many of Impromptu’s standard
reports use Type-In prompts for a date range of data to display.
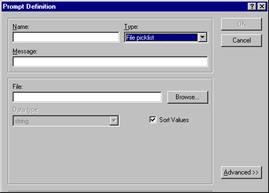
There are three different picklist
prompt types.

A file picklist prompts you to
select a report filter value from a specified text file each time you open or
run the report. The text file must be
saved in a comma delimited ASCII format. File picklist prompts are useful when
you want to filter the report from a specific list of data, rather than the
data in the catalog.
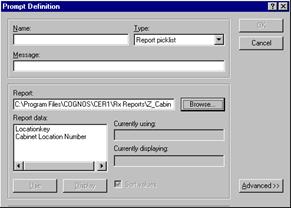
A report picklist prompts you to
select a filter value for the current report from a data item in a saved
report. You select a value from this
saved report when you open or run the report.
You can use a report picklist prompt to limit the information in a
report to the values in another report.
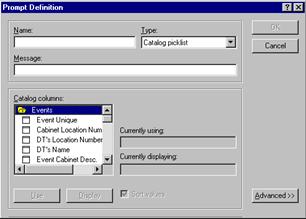
A catalog picklist prompts you to
select a filter value from a folder data item.
The Prompts dialog shows all values for the selected data item. Be sure to select data values only from the
folders (and any subfolders) used to create the report.
The Prompt Definition dialog box has the following fields:
·
Name: A description of the prompt to be created.
·
Type: Indicates what type of prompt’s to be
created.
·
Message: Text to be displayed in the Prompts dialog
box.
·
Data
type: String, number, date, time,
date-time or interval.
·
Default
Value: A default value can be
displayed in the Prompts dialog box.
A
Report Specific prompt can be edited from within the Filter Query dialog
box. To edit a prompt:
1.
Double-click on the prompt name in the Filter
Definition box of the Filter Query dialog box.
The
Prompt Definition dialog box is displayed.
2.
Edit the prompt as desired.
3.
Select the OK
button.
The Prompt
is now modified.
4.
Run the query again to view the modification.
These are signs that specify what
happens to the values on either side of the operator.
Other miscellaneous components may
be displayed, such as parentheses.
There are two types of filters:
·
Detail Filter:
Filters on report data items.
This is the default type of filter.
·
Summary Filter:
If a report includes one or more summary data items, such as total
dispense quantity, you can filter the report on the summary data item using a
summary filter.
Examiner has the option to filter
out repetitive information on a report.
To retrieve only unique rows of data, check the Eliminate
Duplicate Rows check box.
A report can be run with or without its filter by clicking on
the Suspend Detail Filter check
box. When this box is selected, report
data will be retrieved without applying the filter.
Filters are based on expressions
that result in a true-false value. The
most basic filter involves a comparison between two sides of an equation. One side of the equation refers to a report
data item and the other side refers to an entered value.
If the expression equates to true,
then the record is displayed on the report.
Following are syntax for some of the more commonly used operators.
<report data item> > <numeric value> and <report data item> <= <numeric value>
Example: DEA Schedule > 1 and
DEA Schedule <= 6
Note: Numeric values are not enclosed in single
quotes
<report data item> between
<value or expression> and
<value or expression>
Example: Event Date between add-days (now(), -1) and
now()
Note: both
criteria must be met for the value to be returned and displayed on the report.
<report data item> = ‘<value
or expression>’ or
<report data item> = ‘<value
or expression>’
Example: User First Name =
‘Martha’ or User First Name = ‘Mabel’
Note: The equal (=) operator requires an exact
match and is case-sensitive. In this
example, if the database has a user first name value as ‘martha’, this value
would not be displayed on the report.
When using the or
operator, the data item need only meet one of the criteria to be displayed on
the report.
<report data item> in
(value, value, value…)
Example: Status key
in (14, 16, 19, 37)
Note: As many values as necessary can be placed
between the parentheses provided. A
comma separates each value.
<report data item> like
‘<value or expression>%’
Example: Location like ‘Cardi%’
Note: The
percent sign (%) acts as a wild card.
Therefore, all data items that match the text up to the percent sign
will be returned and displayed on the report.
In the above example, the following might be returned: Cardiac, Cardiology, and
Cardiopulmonary. However, CT would not
be returned.
When using the ‘like’ operator, a
percent sign (%) must be used. The like operator is case sensitive.
To reduce the amount of processing
necessary, it is better to use as many characters as possible before the
percent sign (%). It is also more
efficient to not use the percent sign
(%) at the beginning of the expression.
<report data item> contains ‘<value
or expression>’
Example: Location contains ‘ardi’
Note: No
percent sign (%) is needed with the contains
operator.
All data items that contain the
text in the same order are displayed on the report. In the above example, the following might be
returned: Cardiac, cardiac, Cardiology,
cardiology, Cardiopulmonary, cardiopulmonary.
However, Dietary would not be returned even though it contains the
letters ardi; the letters must appear in the same order.
The contains operator is case-sensitive.
It is more efficient to use the like operator than the contains operator if the like operator doesn’t start with the
percent sign (%). The reason is that
that the like operator can use the
database index to retrieve data more efficiently than by searching all database
records, which is what the contains
operator does.
Types of Frames
Frames act as containers for report
objects, such as text, data, pictures, and charts. Frames are the building blocks of Examiner
reports and templates.
Impromptu has five (5) different
types of frames:
1.
List Frame
·
This type of frame holds data in a tabular row
and column format, similar to a spreadsheet.
2.
Text Frame
·
This type of frame holds text or numeric values.
3.
Form Frame
·
A form frame is a container for other frames
used in a report.
4.
Chart Frame
·
A Chart frame is a graphic representation of
data. Charts allow for a quick, visual
evaluation of data.
5.
Picture Frame
·
A Picture frame holds graphics. A hospital logo would be displayed in a
picture frame on a report.
There is no limit on the number of
frames that can be placed within an individual report. Some frames can also be nested within another
frame.
You
can insert frames or report objects into:
Form
frames
List
frames
You
cannot insert frames into:
Chart
frames
Picture
frames
Text
frames
List Frame 
A list frame contains data in rows
and columns, similar to the display of spreadsheets. When you add a report data item, it is
repeated on every row.
List frames can be the entire
report in itself or they can be inserted into other frames to create lists of
data items within a more complex overall report.
To
create a list frame:
1.
From
the menu bar, select Insert,
then select List Frame.
OR…
Click on the List Frame button
 .
.
THEN…
2.
Place the cursor where the list frame is desired
and draw the frame size.
3.
With the list frame selected (highlighted),
From the Insert
menu, select Data.
OR…
From the Report menu, select Query,
then select the Data tab.
OR…
Click
on the Data button  .
.
THEN…
5.
Select
the data to be displayed in the list frame.
List
Properties
Each List frame has properties:
Align, Size, Header/Footer, and Page Breaks.
To
access the list frame properties:
1.
Select the entire list frame.
2.
Right click and select Properties.
Align
The Align tab option allows for aligning objects within a report, or
data items within a frame:
·
Align a frame with the top, bottom, left, right,
or center of its parent frame.
·
Align report objects within a selection box or
within a report.
·
Distribute report objects evenly within a
selection box or within a report.
Size
Resizing can be done manually by
using the object handles or resizing can be done by specifying exact sizes. The
Size tab option of the Properties box is used to specify exact sizes.
·
The height and width can be specified to meet
specific requirements.
·
The report object can be sized to match the
parent frame (Snap to Parent). 
·
The header and/or footer can be sized to match
the width of the columns in a list frame (Snap to Columns).
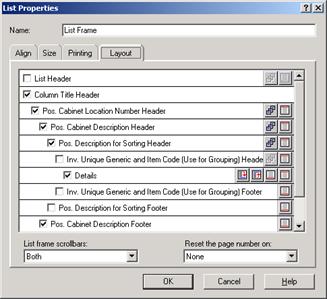
Layout
Headers
and footers can serve a very useful purpose in a list style report. They can
enhance a report’s appearance by containing your company logo, a date, and a
time stamp. Or, you can use these free format areas to highlight grouped data
and provide a location for summaries of detail rows in the report.
The Headers/Footers option tab of the Properties box allows for adding
and removing headers and footers.
This window displays if the list
frame contains a header or footer.
·
If a check appears to the left of the section,
it exists in the list frame. In the
above example, the list frame already has a header and footer.
·
To not include either a header or footer, click
on the check to remove it from the list frame.
Headers
and footers are actually form frames into which any report object can be inserted. Footers should be used when Summarized data
is needed.
Page Breaks
Impromptu has a page break function for list frames that is
similar to a page break when using a word processing software package. If it is desired to start a new section of
the list frame on a new page, simply check it accordingly in the Page Breaks
tab option of the Properties box.
Text Frame

A text frame can contain text that
is manually entered or it can contain data from the database.
·
Text that is manually entered into a text frame
can be manually changed.
·
A text frame containing data from the database
cannot be manually changed.
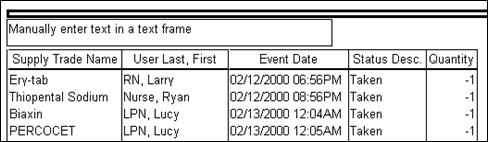
To
add a text frame to a report with manually
entered data:
1.
From the menu bar, select Insert,
then select Text Frame.
OR…
Click on the Text Frame button
.
THEN…
2.
Place the cursor where the text frame is desired
and draw the frame size.
3.
Type the desired text.

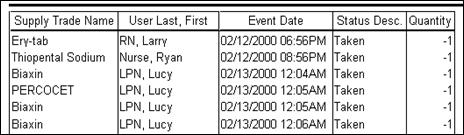
Below is the list report used in the previous section. Every cell in a list frame is a text
frame. This is an example of text frames
containing data from the database. The
text in these text frames cannot be manually edited.
Text
Properties
Each Text frame has properties:
Align, Size, and Layout.
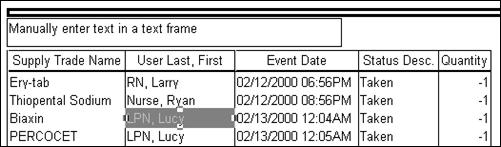
To
access the text frame properties:
1.
Select the entire text frame.
2.
Right click and select Properties.
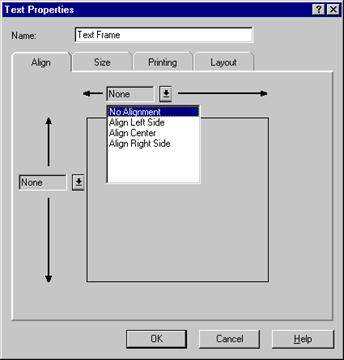
Align
The Align tab option allows for aligning text within a report, or data
items within a frame:
·
Align a frame with the top, bottom, left, right,
or center of its parent frame.
·
Align report objects within a selection box or
within a report.
·
Distribute report objects evenly within a
selection box or within a report.
·
To align multiple text frames, use the align
buttons. 
·
While holding down the Ctrl
key, select the text frames.
·
Select the desired alignment button.
Size
Resizing can be done manually by
using the object handles or resizing can be done by specifying exact sizes. The
Size tab option of the Properties box is used to specify exact sizes.
·
The height and width can be specified to meet
specific requirements.
·
The text frame can be sized to match the parent
frame (Snap to Parent).
·
The text frame can be scanned for best height or
selected to have dynamic height.
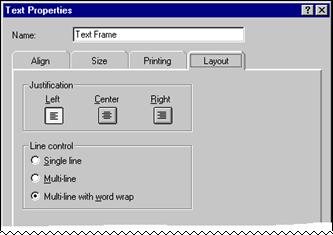
Layout
The Layout tab formats the text within the text frame.
·
The text can be left, center, or right justified
within the text frame.
·
The line control option controls the numbers of
lines in a text frame: single-line,
multi-line, or multi-line with word wrap.
Form Frame 
The Form frame is a feature for creating a master container into which
other frames can be inserted, such as text frames, picture frames, list frames
and chart frames.
For example, a usage report
utilizing a form frame could be created with the following:
·
A picture frame at the top of the form frame
with the hospital logo.
·
A text frame to describe the report.
·
A text frame to indicate the date range of the
data.
·
A list frame displaying usage detail.
·
A chart frame to graphically display the usage
information.
·
A footer for page numbering.
To
create a form frame:
1.
From the menu bar, select File
and then select New.
2.
In the New window, select the Blank
template.
3.
Cancel
the Query box.
4.
A blank report is now created.
5.
From the Insert
menu, select Form Frame.
OR…
Click on the Form Frame
button .
THEN…
6.
Draw the size of the form frame.
7.
Insert frames as needed to create the desired report.
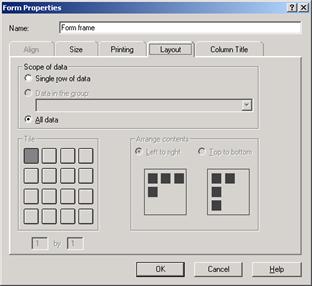
Form
Properties
Each Form frame has properties:
Align, Size, and Layout.
To
access the form frame properties:
1.
Select the entire form frame
2.
Right-click and select Properties.
The Align and Size tab options
allow for the same type of functionality as demonstrated in the other types of
frames.
Layout
The layout tab formats the text
within the form frame. This box contains
two (2) sections:
1.
Scope of Data:
·
Single Row of Data: shows a single row of data values from the
database in each form as you scroll through the report.
·
Data in Group:
shows all rows of values that are associated with the grouped item, such
as a supply name.
·
All Data:
Sets no restrictions on the data values that the form frame can access.
2.
Tiling: This would primarily be used when printing
data on labels where a specific number of form frames must fit exactly within
the boundaries of the label sheet.
A Chart Frame displays data in a
graphical format. Charts are
automatically updated when the data changes.
Charts are powerful because they can be easily interpreted and allows
visual interpretation of trends and exceptions.
Remember: Frames cannot be inserted into Chart Frames;
however a Chart Frame can be added to a Form Frame or inserted into List Frame
headers or footers. Only data contained
by the Parent frame will be displayed.
To
add a Chart Frame:
1.
From the menu bar, select Insert,
then select Chart Frame.
OR…
Click on the Chart Frame button 
THEN…
2.
Place the cursor where the text frame is desired
and draw the frame size.
3.
The Chart Properties dialog box is automatically
displayed to assist in the completion of the Chart Frame.
Each chart frame has
properties: Align, Size, Data and
Format.
The Chart
Properties dialog box is automatically displayed when creating a Chart
Frame. To access the Chart Properties dialog box after the Chart Frame has
been created:
1.
Select the entire Chart Frame.
2.
Right click and select Properties.
The Align and Size tab options allow
for the same type of functionality as demonstrated in the other types of
frames.
Data
The Data tab option determines what
data items to graph in the Chart Frame, and the mode of display. This dialog box is divided into two sections:
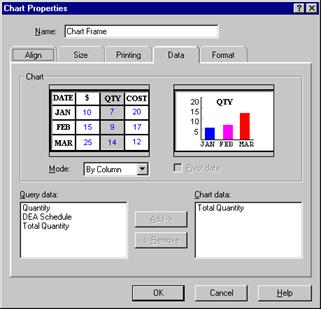
·
Chart (the upper portion): Data items can be plotted by row or
column. This functionality swaps rows
and columns to get a look at the data from a different perspective. Before you pivot the data, you need to have
at least one grouped data item and more than one item in the Chart Data box.
·
Query/Chart Data (lower portion): The numeric values to be charted are assigned
in this section.
?
All numeric data values used in the report are
displayed in the Query Data list box.
?
The Chart Data list box displays all numeric data
fields to be charted. By default, all
numeric data items are listed in the Chart data list box.
To
remove a data item from the Chart Data list box:
1.
Select the data item in the Chart Data list box.
2.
Click the Remove
button.
OR…
Double click on
the data item in the Chart Data list box.
To
add a data item to the Chart Data list box:
1.
Select the data item in the Query Data list box.
2.
Click the Add
button.
OR…
Double-click on
the data item in the Query Data list box.
Format
The Format tab option determines
the chart presentation. This dialog box
has three sections:
·
The Select section allows for labeling and chart
customization.
·
The Sample window displays the general look of
the chart as customization occurs.
·
The Chart Style selection determines the type of
graph in which the data will be displayed.
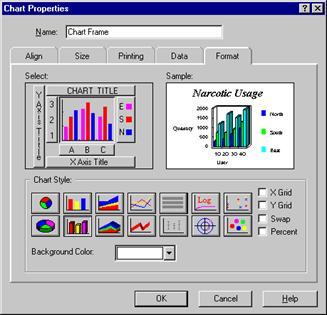
Chart Styles
Examiner offers
three types of charts: Bar, Line, and
Pie charts.
·
Bar and Line charts compare the size of values
in relation to axes.
·
Pie charts are ratio-based charts that compare
the proportion of parts to each other and to the total.
Additional options can be added to
the chart selected:
·
X Grid:
adds vertical lines to the chart that separates X-axis values.
·
Y Grid:
adds horizontal lines to the chart marking values on the Y axis scale.
·
Swap:
changes a bar graph with vertical bars to horizontal bars.
·
Percent:
displays data values as a percentage.
The Chart background color is set
by selecting a color from the drop down list.
The default color is white.
Chart Labeling
The Select section of the Format
dialog box includes six buttons that customize chart labels.
1.
Chart Title: Clicking on this button displays a text box
to enter the Chart Title. A Font button
is provided to choose the font, including size.
2.
Y Axis Title: Clicking on this button displays a text box
in which to enter the label for the Y-axis. A Font button is provided to choose
the font, including size.
3.
X Axis Title: Clicking on this button displays a text box
in which to enter the label for the X-axis. A Font button is provided to choose
the font, including size.
4.
3 2 1: Clicking on this button presents the choice
of showing the Y labels as Examiner determines or customizing the Y-axis
values. A Font button is provided to
choose the font, including size.
5.
A B C: This button represents X-axis values. Clicking on this button displays an option to
not display X-axis values. A Font button
is provided to choose the font, including size.
6.
E S N: This button represents the chart legend. Clicking this button displays two options: Display the legend using Examiner selected
colors or Customize the legend colors. A
Font button is provided to choose the font, including size.
A Picture
Frame is a holder for graphics. Graphics
saved as a bitmap (bmp) or a Device Independent Bitmap (DIB) can be inserted
into a picture frame. The picture can be
static (hospital logo) or dynamic (a picture specific to a data item).
There
are no graphics in the MedSelect database that are associated with data items
(such as images of medications to associate with the med name). For this reason, a dynamic picture frame is
not supported on MedSelect reports.
To
insert a static Picture Frame to an existing report:
1.
From the Insert menu, select Picture Frame.
OR…
Click on the Picture Frame button 
THEN…
2.
Place the cursor where the picture frame is desired and
draw the frame size.
3.
The Picture Properties dialog box is automatically
displayed.
4.
Select Load from file.
5.
Enter the path of the picture or browse for the file.
6.
Select Make a copy within the report.
7.
Select OK.
To
modify a picture frame:
1.
Select the Picture
Frame.
2.
Right click and select Properties.
As
with the other frames discussed, alignment and size properties can also be set
for a picture frame.
The
Access dialog options control the physical connection to the database. This query dialog box consists of three types
of options: Data Retrieval, Data Source, and Query Options.
The
Data Retrieval options determine how much data is retrieved and stored on the
PC.

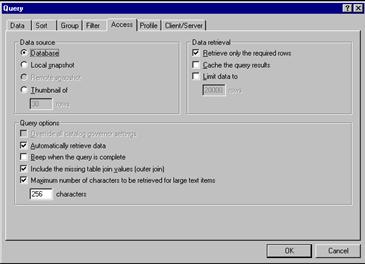
·
Retrieve
only the required rows: This is the
default method of retrieval. This option
retrieves a limited number of records at a time (approximately 50-100). When paging down within a report, Examiner
retrieves more records from the database.
·
Cache the
query results: The report results
are saved in a temporary cache (a special memory subsystem where data will be
duplicated for quick access) on the PC.
·
Limit
Data to < n >: This limits the maximum number of records
retrieved from the database.
To
access the Access dialog box:
1.
From the Report
menu, select Query.
2.
Select the Access
tab option.
The Query dialog box (Access tab option) displays three options for the
source of data.
·
Database: By default, queries access data from the
database.
·
Local
snapshot: A permanent local copy of
the data in the report. When a snapshot
report is opened, the report accesses the data in the Snapshot instead of data
in the database.
·
Thumbnail
of: A temporary data file that
contains a limited number of rows, which is automatically limited to 30
rows. If additional information is
needed, Impromptu goes back to the original database to get it.

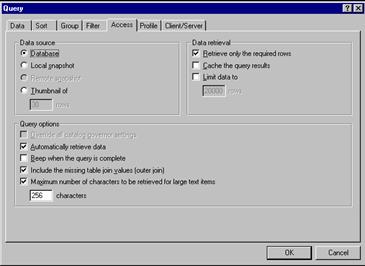
The advantages of using a Local
Snapshot or a Thumbnail include:
·
Speed of retrieval.
·
Reduction of network traffic.
A Snapshot is similar to a
photograph, in that it captures a picture of the data as it was when the report
was created. The data in a Snapshot
report can be displayed or manipulated at a later date, without having to
connect to the database.
Some features of using a Snapshot
include:
·
Report data can be accessed and manipulated
without a database connection.
·
Historical data is static in which it might
otherwise be updated or deleted.
·
The Snapshot report can be shared with others
who may not have access to the database.
This is useful if the report is sent via e-mail to someone else in the
hospital that may not have access to the database.
Once a report has been created, it
can be saved as a Snapshot. A report can be saved as a Snapshot in two ways:
1.
From the File
menu, select Save As.
·
Save the report in the Custom Report folder.
·
Check the Save Snapshot
with Report option in the Save As dialog box.
OR…
2.
Click on the Snapshot button. 
To determine if a report is using a
Snapshot or if it is retrieving data from the database, refer to the Status bar
in the lower right corner of Impromptu.
·
If the report is using a Snapshot, this icon is
displayed.
·
If the report is retrieving data from the
database, this icon is displayed. 
A Snapshot Timestamp can be added
to the Snapshot report. The timestamp
indicates the time the snapshot was taken.
The Snapshot time is particularly
important if the same report is saved at different points in time as a Snapshot. Since the time is embedded into the report,
there is no worry which report is the latest.
To
add a Snapshot Timestamp to a snapshot report:
1.
From the Insert
menu, select More Objects.
2.
Select Snapshot
timestamp from the list box.
3.
Click the Insert
button.
4.
Draw the outline of the text frame.
The Snapshot timestamp is inserted.
 Department Folder
|
|
|
|
|
|
|
Field Name
|
Formats
|
Description
|
|

|
Department Name
|
|
Name of department within the facility.
|
|
|
Dispense Qty default to 1?
|
|
Indicating whether the user must enter the dispense
quantity before dispensing, or the value will default to 1. Values "Yes" or " No".
|
|
|
DT's Auto Logout in Seconds
|
|
The number of seconds without activity on a MedSelect
Display Terminal before the user is automatically logged out.
|
|
|
DT's Restock Auto Logout in Seconds
|
|
The number of seconds without activity on a MedSelect
Display Terminal before the user is automatically logged out during a restock
operation.
|
|

|
Find/Add Patient by ID #?
|
|
Indicates to the DT's in this department that a user may
perform a find function by Patient ID number.
Values "Yes" or "No".
|
|
|
Hide Patients From Find/Add?
|
|
Indicates whether the patient locations associated with
this department can be located by another DT.
Values "Yes" or "No".
|
|
|
MedOrder Browser Sort Order Desc.
|
|
Indicates to the DT's in this department the default sort
order for items on the MedOrder browser.
Values " Give time" or "Supply Name".
|
|
|
# of Leading Dropped Digits
|
|
Number indicating the number of leading digits a DT must
drop from the user card number when a user logs on via the card reader.
|
|
|
# of Trailing Dropped Digits
|
|
Number indicating the number of trailing digits a DT must
drop from the user card number when a user logs on via the card reader.
|
|
|
Patient Browser Sort Order Desc.
|
|
Indicates to the DT's in this department the default sort
order on the Patient browser. Values "Patient Name" or
"Patient Room".
|
|
|
Physician Req'd for Dispense?
|
|
Indicates that a user must associate a physician with the
dispense at the DT. Values
"Yes" or "No".
|
|
|
Reason Req'd for Waste?
|
|
Indicates that a user must associate a reason with the
wasted event at the DT. Values
"Yes" or "No".
|
|
|
Restock Browser Sort Order Desc.
|
|
Indicates to the DT's in this department the default sort
order on the Restock browser. Values "Supply Position" or
"Supply Name".
|
|
|
Supply Sort Order Desc.
|
|
Indicates to the DT's in this department the default sort
order on the Supply, MedOrder and Kit browsers. Values "Trade Name" or
"Generic Name".
|
|
|
Usage Browser Sort Order Desc.
|
|
Indicates to the DT's in this department the default sort
order for items on the Usage browser. Values "Event Date" or
"Supply Name".
|
|
|
Usage Display Hours
|
|
Number of hours of Patient usage information the Display
Terminal will display on the Patient Usage browser.
|
|

|
Witness Req'd for Restock?
|
|
Indicates to the DT's in this department that a witness is
required for a user to perform the restock function. Values "Yes" or "No".
|
|

|
Witness Req'd to open a Discrepant Position?
|
|
Indicates that a witness is required to open a discrepant
position. Values "Yes" or
"No".
|
|
|
|
|
|
Events Folder
|
|
|
|
|
|
|
Field Name
|
Formats
|
Description
|
|
|
Event Unique
|
|
Unique number identifying an event within the MedSelect
system.
|
|
|
Cabinet Location Number
|
|
The cabinets Location Number that is associated with the
event.
|
|
|
DT's Location Number
|
|
The DT's Location Number that is associated with the
event.
|
|
|
DT's Name
|
|
The node name of the DT that is associated with the event.
|
|
|
Event Cabinet Desc.
|
|
The Cabinets Description that is associated with the
event.
|
|
|
Event Dispense Group
|
|
|
|
|
|
|
|
|

|
Discrepancies
subfolder (Parent folder: Events)
|
|
|
Resolution Text
|
|
Text description of the resolution to the discrepancy.
|
|
|
Resolution Flag
|
Y, Null
|
Flag set to indicate that resolution text has been entered
and the discrepancy has been resolved.
|
|

|
Discrepant Event
|
|
Retrieves all discrepant events.
|
|
|
Resolution Event
|
|
Retrieves all resolution events.
|
|
|
Resolved Events Only
|
|
Retrieves all discrepant events that have been resolved.
|
|
|
Event Discrepancy Flag
|
Y, blank
|
A value of Y indicates that a discrepancy between the User
Count Remaining and the System Count Remaining was found during the logging
of this event.
|
|
|
Event Resolution Flag
|
Y, Null
|
A value of Y means this event is a resolution event for a
discrepancy.
|
|
|
|
|
|
|

|
Date Filter Type:
DETAIL ONLY subfolder (Parent folder: Events)
|
|
|
|
|
Use these filters in the Detail Filter type (Under the
Filter Tab - filter options) when there is a need to use Impromptu functions
or the pre-defined filters in the subfolder Filter Type: SUMMARY ONLY.
|
|
|
Event Date >= Now - 60 Days
|
|
|
|
Event Date >= Now - 90 Days
|
|
|
|
Event Date >= Now - 120 Days
|
|
|
|
Event Date >= Now - 150 Days
|
|
|
|
Filter Type:
SUMMARY ONLY subfolder (Parent subfolder: Date Filter Type: DETAIL ONLY)
|
|
|
|
|
|
|
|
Date Ranges subfolder (Parent subfolder: Filter
Type: SUMMARY ONLY)
|
|
|
Yesterday's Begin Date
|
|
You MUST use the
above folder Date Filter Type: DETAIL
ONLY if you use these predefined dates.
Example in the Detail filter put - (Event Date >= Now - 30
Days). Then use these in the SUMMARY
Filter Type. Examples: Event Date
>= Yesterday's Begin Date and Event Date <= Yesterday's End Date, this
will return all events from the previous day.
|
|
|
Yesterday's End Date
|
|
|
|
Previous 7 Days Begin Date
|
|
|
|
Previous 7 Days End Date
|
|
|
|
Previous Month Begin Date
|
|
|
|
Previous Month End Date
|
|
|
|
|
|
|
|
|
1st of each Month subfolder
(Parent subfolder : Filter Type: SUMMARY ONLY)
|
|
|
Jan. 1st current year
|
|
You MUST use
the above parent folder Date Filter
Type: DETAIL ONLY. Example Run a
report in February and in the Detail filter put - (Event Date >= Now - 30
Days). Then in the Summary Filter Type.
Examples: (Event Date >=
Jan. 1st current year and Event Date < Feb. 1st current year), this will
return all events for the month of January of the current year.
|
|
|
Feb. 1st current year
|
|
|
|
March 1st current year
|
|
|
|
April 1st current year
|
|
|
|
May 1st current year
|
|
|
|
June 1st current year
|
|
|
|
July 1st current year
|
|
|
|
Aug. 1st current year
|
|
|
|
Sept. 1st current year
|
|
|
|
Oct. 1st current year
|
|
|
|
Nov. 1st current year
|
|
|
|
Dec. 1st current year
|
|
|
|
Dec. 1st of last year
|
|
|
|
|
|
|
|
|
Quarterly Dates
subfolder (Parent subfolder : Filter Type: SUMMARY ONLY)
|
|
|
1st Quarter
|
|
Retrieves events that occurred in January, February, and
March of the current year.
|
|
|
2nd Quarter
|
|
Retrieves events that occurred in April, May and June of
the current year.
|
|
|
3rd Quarter
|
|
Retrieves events that occurred in July, August and
September of the current year.
|
|
|
4th Quarter
|
|
Retrieves events that occurred in October, November and
December of the previous year.
|
|
|
Q1 Begin Date
|
|
You MUST use
the subparent folder Date Filter Type:
DETAIL ONLY. Example Run a report
in January and in the Detail filter put - (Event Date >= Now - 120
Days). In the SUMMARY Filter put the
filter - (4th Quarter) and your report will include all events for the 4th Quarter
of the previous year. Move the Desired
Begin and End Date to the Data Tab to print on the report Header.
|
|
|
Q1 End Date
|
|
|
|
Q2 Begin Date
|
|
|
|
Q2 End Date
|
|
|
|
Q3 Begin Date
|
|
|
|
Q3 End Date
|
|
|
|
Q4 Begin Date
|
|
|
|
Q4 End Date
|
|
|
|
|
|
|
|
|
|
|
|
|
|
|
|
|
Events Folder (continued)
|
|
|
|
|
|
|
Event Date
|
|
The date and time that an event occurs.
|
|
|
Event Post Date
|
|
The date and time that an event is written to the
database.
|
|
|
Event Physician Last, First
|
|
Combined field consisting of the physician's surname and
first name selected from the physician/route/site button on the supply
picklist.
|
|
|
Ordering Physician Last, First
|
|
Combined field consisting of the MedOrder physician's
surname and first name.
|
|
|
Quantity
|
|
Quantity of the
supply effected by the event (e.g. quantity taken, returned, stocked or
wasted).
|
|
|
Reason Desc.
|
|
Text describing a facility defined reason for wasting or
returning a supply, usually a medication.
|
|
|
Route Desc.
|
|
Text describing the medication administration route (e.g.
Apply externally, Intravenous). HL7
defined routes are supplied for the facility, however, the facility may add
additional routes.
|
|
|
Site Desc.
|
|
Text describing the administration site (e.g. Left Arm,
Buttock). HL7 defined sites are supplied for the facility, however, the
facility may add additional sites.
|
|
|
|
|
|
|
|
Status Filters
subfolder (Parent folder: Events)
|
|
|
Status Key
|
|
Unique key identifying a status.
|
|
|
Cancel Dispense
|
72
|
Retrieves Canceled Events.
|
|
|
Dept. Resolved Charge
|
38
|
Retrieves events that indicate a charge imposed to a
Department to offset the effects of a quantity discrepancy.
|
|
|
Dept. Resolve Credit
|
39
|
Retrieves events that indicate a credit imposed to a
Department to offset the effects of a quantity discrepancy.
|
|
|
Dept. Return
|
47
|
Retrieves events that indicate that a User reported Too
Many when dispensing from a UDM and Automatically Returned the unwanted
dispenses.
|
|
|
Expired
|
13
|
Retrieves events that indicate that Medication or Supplies
were removed from the MedSelect System because their expiration date had
passed.
|
|
|
Open Position
|
37
|
Retrieves open position events.
|
|
|
Patient Resolved Charge
|
29
|
Retrieves events that indicate a charge imposed to a
Patient to offset the effects of a quantity discrepancy.
|
|
|
Patient Resolved Credit
|
19
|
Retrieves events that indicate a credit imposed to a
Patient to offset the effects of a quantity discrepancy.
|
|
|
Retrieved
|
18
|
Retrieves events that indicate that medication or supplies
were removed from the return and retrieve positions.
|
|
|
Return
|
14
|
Retrieves events that indicates a credit for a medication
that was returned after it was dispensed.
|
|
|
Return Adjusted
|
22
|
Retrieves events that indicate that a Returned event has
been transferred to another record.
When a transfer occurs, the original Returned event is renamed to
Returned Adjusted. This can only
happen when the associated Taken event is transferred; A Returned event cannot be transferred by
itself.
|
|

|
Return Transfer In
|
26
|
Retrieves events that indicate that this account has
received a Returned event that was transferred from another account. There must be a corresponding Taken
Transfer In.
|
|
|
Return Transfer Out
|
24
|
Retrieves events that indicate that a Returned event has
been transferred from this account to some other account. The account receives a new event called
Returned Transfer Out.
|
|
|
Return Unknown
|
34
|
Retrieves events that indicate a credit for a medication
that was dispensed Online and the Return occurred Offline. Use the AWS's Account Adjustment to
associate this Return with its Taken.
|
|
|
Stocked
|
27
|
Indicates that medication or supplies were Stocked into
the MedSelect System.
|
|
|
Taken
|
16
|
Retrieves events that indicate a charge for a medication
that was dispensed for a patient.
|
|
|
Taken Adjusted
|
12
|
Retrieves events that indicate that a Taken event has been
transferred to another record. The
original Taken event is renamed to Taken Adjusted. When a Taken event is transferred, any
corresponding Returned or Wasted events will also be transferred.
|
|
|
Taken Transfer In
|
25
|
Retrieves events that indicate that this account has
received a Taken event that was transferred from another account. The Taken Transfer in event is a charge to
the account.
|
|
|
Taken Transfer Out
|
20
|
Retrieves events that indicate that a Taken event has been
transferred from this account to some other account. The Taken Transfer Out credits the account
to offset the charge imposed by the original Taken event.
|
|
|
Taken Unknown
|
33
|
Retrieves events that indicate that a Taken event is not
associated with a Patient.
|
|
|
Unload
|
73
|
Retrieves events that indicate that a medication or supply
was removed from the MedSelect System.
|
|
|
Wasted
|
17
|
Retrieves events that indicate a credit for a medication
that was wasted after it was dispensed.
|
|
|
Wasted Adjusted
|
21
|
Retrieves event that indicate that a Wasted event has been
transferred to another record. When a
transfer occurs, the original Wasted event is renamed to Wasted
Adjusted. This can only happen when
the associated Taken event is transferred; A Wasted event cannot be
transferred by itself.
|
|
|
Wasted Transfer In
|
27
|
Retrieves events that indicate that this account has
received a Wasted event that was transferred from another account. There must be a corresponding Taken
Transfer In.
|
|
|
Wasted Transfer Out
|
23
|
Retrieves events that indicate that a wasted event has
been transferred from this account to some other account. The original account receives a new event
called Wasted Transfer Out.
|
|
|
Wasted Unknown
|
36
|
Retrieves events that indicate a credit for a medication
that was dispensed Online and the Wasted occurred Offline. Use the AWS's Account Adjustment to
associate this Waste with its Taken.
|
|
|
|
|
|
Events Folder (continued)
|
|
|
|
|
|
|
Status Desc.
|
|
Text description of an event status.
|
|
|
Status Desc. w/ Discrepancy Flag
|
|
Text description of an event status with "(D)"
appended to the text if the event was discrepant.
|
|
|
Supply Position Desc.
|
|
Description of the supply position, e.g. Unit Dose Module
1 Bin 4, Drawer Module 3 Drawer 2 Compartment 12, Cabinet 1 Hook 10, Cabinet
3 Box 1-1.
|
|
|
Supply Position Desc. for Sorting
|
|
Use this field for sorting Supply Position Desc. In
Logical order.
|
|
|
|
|
|
|
|
Supply Position
Details subfolder (Parent folder: Events)
|
|
|
Failed Flag
|
Y or Null
|
Indicates a discrepancy occurred during a dispense and the
position is Failed.
|
|
|
Is this Position Failed?
|
|
Text description of the Failed FLAG explaining whether a
position is failed. Values
"Yes" or "No".
|
|
|
Position Current Qty
|
|
The quantity of a supply occupying a specific supply
position.
|
|
|
Position Desc. w/ Failed Flag
|
|
Text description of the supply position with
"(F)" appended to the text if the supply position is Flagged as
Failed.
|
|
|
Position Lot #
|
|
Lot Number to which the medication assigned to the
position belongs.
|
|
|
Position Maximum Qty
|
|
The maximum amount of a supply that a facility wants to
keep in a particular supply position.
The amount reordered is the difference between maximum quantity and
the position quantity.
|
|
|
Position Minimum Qty
|
|
The minimum amount of a supply that a facility wants to
keep in a particular supply position.
|
|
|
Position Nearest Expiration Date
|
|
Date the medication assigned to the position is to expire.
|
|
|
Position Return Drawer Flag
|
I,O or Null
|
Flag indicating whether a drawer can accept returns. I - accepts returns, O- allows retrieval of
returns, Null - does not accept or allow retrieval of returns.
|
|
|
No Expiration Date
|
|
Retrieves positions that do not have a Nearest Expiration Date.
|
|
|
Past Expiration Date
|
|
Retrieves positions whose Nearest Expiration Date has
past.
|
|
|
Position is Failed
|
|
Retrieves positions that are Flagged as Failed.
|
|
|
Quantity is Below Minimum
|
|
Retrieves positions whose Current Qty is less than the
Positions Minimum Qty.
|
|
|
Return and Retrieve Positions
|
|
Retrieves Return and Retrieve Drawers.
|
|
|
Position Status = 'A'
|
|
Retrieves positions that have not been deleted.
|
|
|
Supply Position is Counted Med/Supplies
|
|
Retrieves all positions that are counted.
|
|
|
Supply Position is Not Counted Med/Supplies
|
|
Retrieves all positions that are not counted. These are SmartStock Par Level positions.
|
|
|
|
|
|
|
|
|
|
|
Events Folder (continued)
|
|
|
|
|
|
|
System Count Remaining
|
|
The number of supplies remaining in a compartment as known
by the MedSelect system.
|
|
|
System Dispense Count
|
|
The number of supplies dispensed as known by the MedSelect
system.
|
|
|
Unused Amount
|
|
The amount of a supply, usually a medication, that was
wasted or returned.
|
|
|
Unused Units
|
|
The units of the wasted or
returned supply (e.g. ml).
|
|
|
User Last, First
|
|
Combined field consisting of a user's surname and first
name.
|
|
|
Witness Last, First
|
|
Combined field consisting of a witness surname and first
name.
|
|
|
User / Witness
|
|
Combined field consisting of user surname and first name
and the witness surname and first name if required.
|
|
|
User Count Remaining
|
|
The number entered by the user indicating the amount of a
supply remaining in a compartment.
|
|
|
User Dispense Count
|
|
The number entered by the user indicating the amount of a
supply actually dispensed.
|
|
|
|
|
|
|
|
MedOrder Event
Details subfolder (Parent folder: Events)
|
|
|
MedOrder Prescribed Date
|
|
Date and time a medication is to be administered. This information is provided by the
interface.
|
|
|
MedOrder Number
|
|
A facility system assigned number for a medication order.
|
|
|
MedOrder Frequency
|
|
The number of times to administer a medication within a
certain period of time.
|
|
|
MedOrder PRN
|
|
Indicates the MedOrder is a PRN. Values "(PRN)" or Null if the
order is not a PRN.
|
|
|
MedOrder Given Late
|
|
Retrieves events that indicate that the MedOrder was given
past the defined Due Window.
|
|
|
|
|
|
|
|
Centrack Status
Filters subfolder (Parent folder: Events) (Centrack Catalog Login ONLY)
|
|
|
Status Key
|
|
Unique key identifying a status.
|
|
|
Audit
|
89
|
Retrieves events that indicate an audit was performed on
the supply position.
|
|
|
Borrow
|
86
|
Retrieves events that indicate medications that were
borrowed from an outside facility and deposited in the Pharmacy.
|
|
|
Deposit
|
74
|
Retrieves events that indicate medications have been
deposited into the Pharmacy.
|
|
|
Deposit Compound
|
90
|
Retrieves events that indicate compound medications have
been deposited into the Pharmacy.
Withdraw Ingredient events from the pharmacy are used to create the
compound.
|
|
|
Deposit Unit Package
|
91
|
Retrieves events that indicate medications have been deposited into the
Pharmacy. Withdraw Bulk events from
the pharmacy are separated into Unit Packages for the deposit.
|
|
|
Expire Pharmacy
|
77
|
Retrieves events that indicate medications have been
removed from the pharmacy because their
expiration date has passed.
|
|
|
Loan
|
85
|
Retrieves events that indicate medications that were
removed from the pharmacy and loaned to another facility.
|
|
|
Quarantine
|
80
|
Retrieves events that indicate medications that have been
Quarantined and are waiting to be surrendered.
|
|
|
Recall
|
79
|
Retrieves Recall Centrack Events.
|
|
|
Return Borrow
|
88
|
Retrieves events that indicate the return event of a
medication that was borrowed from an outside facility.
|
|
|
Return Loan
|
87
|
Retrieves events that indicate medications that have been
returned after being loaned to another facility.
|
|
|
Return Pharmacy
|
76
|
Retrieves events that indicate a medication is deposited
back into the Pharmacy.
|
|
|
Sell
|
84
|
Retrieves events that indicate medications removed from
the pharmacy and sold to another facility.
|
|
|
Surrender
|
81
|
Retrieves Surrender Centrack Events.
|
|
|
Waste Pharmacy
|
78
|
Retrieves events that indicate a medication was wasted at
the Pharmacy.
|
|
|
Withdraw
|
75
|
Retrieves events that indicate a medication was removed
from the Pharmacy.
|
|
|
Withdraw Bulk
|
83
|
Retrieves events that indicate a medication was removed
from the pharmacy inventory to be separated into unit dose packages.
|
|
|
Withdraw Ingredient
|
82
|
Retrieves events that indicate a medication was removed
from the pharmacy inventory to be used to make a compound medication.
|
|
|
|
|
|
|
|
Centrack 41, 222
& Paper Tracking Details subfolder (Parent folder: Events)
(Centrack Catalog
Login ONLY)
|
|
|
Form Type
|
222, 41
|
i.e. Form 222, Form 41.
|
|
|
Form -222 Form No:
|
|
Number uniquely identifying a form of a given type (i.e.
Form 222 Serial Number, Invoice number).
|
|
|
Form Date
|
|
Date/Time the electronic form was prepared.
|
|
|
Form-41 Package No:
|
|
|
|
|
Paper T. Control #:
|
|
Unique number to identify Paper Tracking events.
|
|
|
External Facilities
subfolder (Parent subfolder: Centrack 41,222 & Paper Tracking Details
subfolder) (Centrack Catalog Login ONLY)
|
|
|
External Facility use for Grouping
|
|
Unique combined field for grouping and sorting.
|
|
|
Ext. Facility Name
|
|
The name of the external medical facility.
|
|
|
Ext. Address1
|
|
First line of facility street address.
|
|
|
Ext. Address2
|
|
Second line of facility street address.
|
|
|
City, State Zip
|
|
Combined field consisting of the External Facilities
City, State and Zip
Code.
|
|
|
Ext.
City
|
|
City where facility resides.
|
|
|
Ext.
State
|
|
State where facility resides.
|
|
|
Ext. Zipcode
|
|
Post office zip code for the facility.
|
|
|
Ext. DEA Registration Number
|
|
Unique alphanumeric code which identifies the facility to
the DEA.
|
|
|
Ext. Phone Number
|
|
Phone number for the external facility.
|
Events In-Transit Folder (Centrack
Catalog Login ONLY)
|
|
|
|
|
|
|
Field Name
|
Formats
|
Description
|
|
|
EIT. In-Transit Key
|
|
Unique number identifying an In-Transit event within the
MedSelect system.
|
|
|
EIT. Display Terminal or Centrack Terminal
|
|
Indicates which application created the In-Transit
event. If Centrack created the event,
" - Centrack " is appended to the DT name.
|
|
|
EIT. DT to Restock
|
|
DT that is the recipient of the Centrack event.
|
|
|
EIT. Paper Tracking Control #
|
|
The Paper Tracking control #.
|
|
|
EIT. Status Desc.
|
|
Text description of a status of an In-Transit event.
|
|
|
EIT. Supply Position Desc.
|
|
Description of the supply position of the In-Transit event
(e.g. Unit Dose Module 1 Bin 4, Drawer Module 3 drawer 2 Compartment 12, Cabinet
1 Hook 10, Cabinet 3 Box 1-1).
|
|
|
EIT. Logdate from Event Table
|
|
The date and time that the In-Transit event occurred.
|
|
|
EIT. Quantity
|
|
Absolute (Quantity) of
the supply effected by the In-Transit event.
|
|
|
EIT. User Last, First
|
|
Combined field consisting of the surname and first name of
the user that created the In-Transit event.
|
|
|
EIT. Supply Generic Name, Strength, Size, Units, Form
|
|
Combined field containing Supply Generic Name, Strength,
Size, Units and Form.
|
|
|
EIT. DEA 2 Prime Sort
|
|
This Field is grouped by DEA 2's. Then the DEA 2's are
alphabetical by Generic Name in ascending order, and all other DEA Schedules
follow alphabetically by Generic Name in ascending order.
|
|
|
EIT. DEA Schedule
|
|
Text description of EIT. DEA Schedule Key. Values "1", "2",
"3", "4", "5", "6", "OTC"
and "Legend".
|
|
|
EIT. DEA Schedule Key
|
1, 2, 3, 4, 5, 6, 37, 38
|
A Drug Enforcement Agency defined class of drug. Also
MedSelect defined classes, 37 = OTC and 38 = Legend.
|
|
|
EIT. Unique Generic
|
|
Unique Combined field for grouping and sorting by Generic
Name.
|
|
|
EIT. Paper Tracking Only
|
|
Retrieve paper tracking events only.
|
|
|
|
|
|
|
|
|
|
|
Facility Folder
|
|
|
|
|
|
|
Field Name
|
Formats
|
Description
|
|
|
AWS timeout
|
|
The number of seconds without activity on an AWS Before
the user is automatically Logged out.
|
|
|
Card Swipe Req'd?
|
|
Indicates to the DT's that a user card must be used to log
on to the DT. Values "Yes"
or "No".
|
|
|
Card Swipe Flag
|
Y, Null
|
Flag indicating to the DT's that a user card must be used
to log on to the DT.
|
|
|
Database Version
|
|
Alphanumeric value indicating the database version.
|
|
|
DEA Registration #
|
|
Alphanumeric code which identifies the facility to the
DEA.
|
|
|
Display Closed Visits?
|
|
Indicates whether the DT's should display closed visits
during a find/add operation. Values
"Yes" or "No".
|
|
|
Display Closed Visits Flag
|
1, 0
|
Flag indicating whether the DT should display closed
visits during a find/add operation. 1
- Yes, 0 - No.
|
|
|
Facility Name
|
|
The name of the medical facility.
|
|
|
MedOrder Due Window
|
|
The delta time surrounding a medication order give time in
which the dose is considered to be due.
|
|
|
MedOrder Due Late Window
|
|
After the lateWindow delta time has passed, the medication
will no longer be displayed in the GiveSchedule Browser at the DT.
|
|
|
Number of Login tries
|
0 - 9
|
The number of consecutive times a user can unsuccessfully
login before the user's account is
made inactive. Zero indicates
unlimited login tries.
|
|
|
Report Date Criteria
|
|
Indicates the number of days previous to today that should
be displayed on all reports.
|
|
|
Software Version Number
|
|
A number that uniquely identifies a release of the
MedSelect Dispensing System software, e.g. V2.3.
|
|
|
System MedOrder Override
|
Datetime or Null
|
This field stores the date and time the MedOrder interface
went down, or is no longer receiving MedOrders. This date must be set by a user at the
AWS. Setting this date allows all
MedOrder required medications to be dispensed without a MedOrder.
|
Patient and Visit Folder
|
|
|
|
|
|
|
Field Name
|
Formats
|
Description
|
|
|
External System ID
|
|
Unique Identifier for a patient to an external hospital
system.
|
|
|
External Patient ID
|
|
Unique patient identifier to an external hospital system.
|
|
|
Medical Record Number
|
|
A facility assigned number associated with a patient’s
facility records.
|
|
|
Patient Allergies
|
|
A list of known patient allergies to drugs.
|
|
|
Patient Created by Desc.
|
|
Indicates which application created the visit record. Values "AWS", "Display
Terminal" and "Interface".
|
|
|
Patient Gender
|
M, F, O, U
|
Male, Female, Other, Unknown
|
|
|
Patient ID #
|
|
A number assigned by the facility to uniquely identify a
patient.
|
|
|
Patient Last, First
|
|
Combined field consisting of a patient's surname and first
name.
|
|
|
Unique Patient Name (Use for Grouping)
|
|
Use this field to group and sort a report by patient
name. Will prevent patients with the
same name, e.g. John Smith's from being grouped together.
|
|
|
|
|
|
|
|
Visit subfolder
(Parent folder: Patient and Visit)
|
|
|
Admission Date
|
|
The date and time
the patient was admitted to the facility.
|
|
|
Admission Height
|
|
The patient’s height at the time of admission.
|
|
|
Admission Weight
|
|
The patient’s weight at the time of admission.
|
|
|
Admitting Physician Last, First
|
|
Combined field consisting of an admitting physician
surname and first name.
|
|
|
Admitting User Last, First
|
|
Combined field consisting of a user surname and first name
that is logged in to the MedSelect System, who last changed the status of
this visit.
|
|
|
Discharge Date
|
|
The date and time that a patient is discharged from the
facility.
|
|
|
External Account #
|
|
Unique identifier representing a patient billing account
within the hospital.
|
|
|
Patient Bed #
|
|
A value that distinguishes each bed in a location.
|
|
|
Patient Class Desc.
|
|
Text description that indicates how a patient was admitted
into the facility. Values
"In-Patient", "Out-Patient", "Emergency",
"Pre-Admit" and "Re-Occurring".
|
|
|
Patient Room/Bed
|
|
Combined field of the patients room and bed #.
|
|
|
Patient Room #
|
|
A patient's location, or room, to the MedSelect system.
|
|
|
Visit Close Date
|
|
The date and time that a visit record is closed.
|
|
|
Visit Created By Desc.
|
|
Indicates which application created the visit. Values "AWS", "Display
Terminal" and "Interface".
|
|
|
Visit Closed By Desc.
|
|
Indicates which application closed the visit. Values "AWS", "Display
Terminal" and "Interface".
|
|
|
Visit #
|
|
Unique number assigned by the facility for a patient
visit.
|
|
|
Visit Status Desc.
|
|
The current status of a visit at a point in time. Values “Open”, “On-Hold”, and “Closed”.
|
|
|
Open Visits
|
|
Retrieves patients with Open Visits.
|
|
|
On-Hold Visits
|
|
Retrieves patients with On-Hold Visits.
|
|
|
Closed Visits
|
|
Retrieves patients with Closed Visit.
|
|
|
|
|
|
|
|
Patient Class
Filters subfolder (Parent folder: Patient and Visit)
|
|
|
Patient Class
|
I, O, E, P, R
|
How a patient was admitted into the facility, e.g. I =
in-patient, O = out patient, E = emergency, P = pre-admit and R =
Reoccurring.
|
|
|
In-Patient
|
|
Retrieves visits that are classified as In-Patient.
|
|
|
Emergency
|
|
Retrieves visits that are classified as Emergency.
|
|
|
Out-Patient
|
|
Retrieves visits that are classified as Out-Patient.
|
|
|
Re-Occurring
|
|
Retrieves visits that are classified as Re-Occurring.
|
|
|
Pre-Admit
|
|
Retrieves visits that are classified as Pre-Admit.
|
|
|
|
|
|
|
|
Visit Created by
Filters subfolder (Parent folder: Patient and Visit)
|
|
|
Visit Created By
|
A, D, I
|
Code indicating which application in the MedSelect System
created the visit record, e.g. A- AWS, D- Display Terminal or I- Interface.
|
|
|
Created By AWS
|
|
Retrieves visits that were added to the MedSelect System
via the AWS.
|
|
|
Created By DT
|
|
Retrieves visits that were added to the MedSelect System
via the Display Terminal.
|
|
|
Created By
Interface
|
|
Retrieves visits that were added to the MedSelect System
via the Interface.
|
|
|
Visit Closed By
Filters subfolder (Parent folder: Patient and Visit)
|
|
|
Visit Closed By
|
A, D, I,
|
Code indicating which application in the MedSelect System
closed the visit record, e.g. A- AWS, D- Display Terminal or I- Interface.
|
|
|
Closed By AWS
|
|
Retrieves visits that were closed via the AWS.
|
|
|
Closed By (Close
Old Visits)
|
|
Retrieves visits that were closed via the Close Old Visits
procedure.
|
|
|
Closed By Interface
|
|
Retrieves visits that were closed via the Interface.
|
|
|
|
|
|
|
|
Patient Details
subfolder (Parent folder: Patient and Visit)
|
|
|
Patient Name Prefix
|
|
Titles, such as Dr., Mr., Ms., etc.
|
|
|
Patient First
|
|
A patient’s first name or initial.
|
|
|
Patient Middle
|
|
The patient’s middle name or initial.
|
|
|
Patient Last
|
|
A patient’s surname.
|
|
|
Patient Name Suffix
|
|
Descriptors that would normally follow a name, such as
Jr., III, Md., Ph.D., etc.
|
|
|
Patient Upper Last
|
|
The patient’s surname in capital letters.
|
|
|
Patient Upper First
|
|
The patient’s first name in capital letters.
|
|
|
Patient Address 1
|
|
First line of patient street address.
|
|
|
Patient Address 2
|
|
Second line of patient street address.
|
|
|
Patient
City
|
|
City where patient resides.
|
|
|
Patient
State
|
|
State where patient resides.
|
|
|
Patient Zip
|
|
Post office zip code for the patient’s residence.
|
|
|
Patient Country
|
|
Country where patient lives.
|
|
|
Patient Home Phone #
|
|
Patient's home telephone number.
|
|
|
Patient Birth Date
|
|
The date the patient was born.
|
|
|
|
|
|
Physicians Folder
|
|
|
|
|
|
|
Field Name
|
Formats
|
Description
|
|
|
Physician Code
|
|
Unique facility defined code for identifying a physician.
|
|
|
Physician Last, First
|
|
Combined field consisting of a physician's surname and
first name.
|
|
|
Physician Name and Code Unique Grouping
|
|
Use this field for grouping and sorting a report by
physician name. Will prevent
physicians with the same name, e.g. John Smith's from being grouped together.
|
|
|
Physician First
|
|
The first name or initial of a physician at the facility.
|
|
|
Physician Last
|
|
A physician’s surname.
|
|
|
Physician Middle
|
|
A physician’s middle name or initial.
|
|
|
Physician Name Prefix
|
|
Titles, such as Dr., Mr., Ms., etc.
|
|
|
Physician Name Suffix
|
|
Descriptors that would normally follow a name, such as
Jr., III, Md., Ph.D., etc.
|
|
|
Physician Preferences
|
|
Text describing any preferences a physician may have while
performing a procedure, e.g. music, glove size, etc.
|
|
|
Physician Unique
|
|
Unique number identifying a physician within the MedSelect
system.
|
Supplies Folder
|
|
|
|
|
|
|
Field Name
|
Formats
|
Description
|
|
|
Accept MedOrders
|
|
Text description of supply option which indicates
whether MedSelect should accept
MedOrders for this supply. Values
"Yes" or "No".
|
|
|
Count Remaining Req'd
|
|
Text Description of supply option which indicates whether
the positions contents must be recounted every time a supply is taken
(dispensed) or returned to the MedSelect.
Values "Yes" or "No".
|
|
|
Count Remaining Req'd Centrack (Centrack Catalog Login
Only)
|
|
Text description of Centrack supply option which indicates
whether the supply must be recounted every time a supply is taken from or
returned to the Centrack System.
Values "Yes" or "No".
|
|
|
DEA 2 Prime Sort
|
|
This Field is grouped by DEA 2's. Then the DEA 2's are
alphabetical by Generic Name in ascending order, and all other DEA Schedules
follow alphabetically by Generic Name in ascending order.
|
|
|
DEA Schedule
|
|
Text description of DEA Schedule Key. Values "1", "2",
"3", "4", "5", "6", "OTC"
and "Legend".
|
|
|
DEA Schedule Key
|
1, 2, 3, 4, 5, 6, 37, 38
|
A Drug Enforcement Agency defined class of drug. Also
MedSelect defined classes, 37 = OTC, 38 = Legend.
|
|
|
Defined Class Desc.
|
|
Facility defined class associated with this supply.
|
|
|
Manufacturer Part #
|
|
The number assigned by a manufacturer to identify a
supply.
|
|
|
MedOrder Req'd to Dispense
|
|
A customer option that indicates that a medication must be
in the Patient’s MedOrder profile before it can be dispensed. Values "Yes" or "No".
|
|
|
Returned to Original Drawer
|
|
Indicates whether this supply is to be returned to its
original drawer rather than to the return drawer. This only applies to supplies assigned to
non-UDM positions. Values
"Yes" or "No".
|
|
|
Send to Billing Interface
|
|
Indicates whether dispenses of this supply should be sent
to the billing interface. Values
"Yes" or "No".
|
|
|
Supply Charge Code
|
|
Facility code used for billing a supply.
|
|
|
Supply Cost
|
|
The latest cost of a particular supply.
|
|
|
Supply Unique Key
|
|
Unique Supply Key field for grouping.
|
|
|
Supply Generic Name
|
|
The non-trademark name for a supply or the chemical name
for a medicine.
|
|
|
Supply Generic Name, Strength, Size, Units, Form
|
|
Combined field containing Supply Generic Name, Strength,
Size, Units and Form.
|
|
|
Supply NDC Code
|
|
National Drug Code (NDC) is a pharmacy defined code for
specifying medications.
|
|
|
Supply Pharmacy Location
|
|
Description of a location within the pharmacy where
medication is located.
|
|
|
Supply Generic & Item for Sort Group
|
|
Unique combined field for grouping and sorting by Generic
Name.
|
|
|
Supply Trade & Item for Sort Group
|
|
Unique combined field for grouping and sorting by Trade
Name.
|
|
|
Supply Trade Name
|
|
The proprietary name protected by US trademark for a
supply.
|
|
|
Supply Vendor #
|
|
Number assigned by the facility which uniquely identifies
the vendor of a supply.
|
|
|
System Current Qty
|
|
The actual quantity of this supply currently being stored
by MedSelect.
|
|
|
System Maximum Qty
|
|
The maximum quantity of this supply that should be in
stock. Maximum quantities prevent
over-stocking.
|
|
|
System Minimum Qty
|
|
The minimum quantity of a supply that a facility wants to
keep in inventory. The supply should
be re-ordered when minimum is reached.
|
|
|
Waste Witness Req'd
|
|
A customer option that indicates that a second user must
login to witness the wasting of a supply, usually a controlled
medication. Values "Yes" or
"No".
|
|
|
Centrack Supplies Only
(Centrack Catalog Login ONLY)
|
|
Retrieves supplies that are stocked in the Centrack Vault.
|
|
|
|
|
|
|
|
Supply Details
subfolder (Parent folder Supplies)
|
|
|
Item Code
|
|
The number assigned by the facility to uniquely identify a
supply. For medications, this is the
facility formulary number.
|
|
|
Supply Form
|
|
The form of the substance (e.g. capsule or tablet).
|
|
|
Supply Size
|
|
The per unit amount of a supply (e.g. 400 units).
|
|
|
Supply Size Units
|
|
The measurement used with a supply size, e.g. mg, ml, etc.
|
|
|
Supply Size and Size Units
|
|
Combined field containing Supply Size & Supply Size
Units.
|
|
|
Supply Strength
|
|
Application strength of the prescribed med.
|
|
|
|
|
|
|
|
Supply Flags
subfolder (Parent folder Supplies)
|
|
|
Accept MedOrders Flag
|
A, I
|
Used for a MedOrder
interface to indicate whether MedSelect should accept MedOrders for this
supply. A - Yes, I - No.
|
|
|
Bill Flag
|
B, N
|
Character indicating whether supply is billable or
nonbillable. B - billable, N - nonbillable.
|
|
|
Count Remaining Req'd Flag
|
Y, N
|
Flag indicating that the supply must be recounted every
time a supply is taken or returned. Y
- Yes, N - No.
|
|
|
MedOrder Req'd Flag
|
Y, N
|
A customer option that indicates that a medication must be
in the Patient’s profile before it can be dispensed. Y - Yes, N - No.
|
|
|
Centrack Count Remaining Req'd Flag
(Centrack Catalog Login ONLY)
|
Y, Null
|
Flag indicating that the supply must be recounted every
time a supply is taken from or returned to the pharmacy. Y - Yes, Null - No.
|
|
|
Return Meds to Original Drawer Flag
|
Y, N
|
Flag indicating whether this supply can be returned to its
original drawer rather than to the return drawer. This flag does not apply to UDM's. Y - Yes, N - No.
|
|
|
Waste Witness Req'd Flag
|
Y, N
|
A customer option that indicates that a second user must
login to witness the wasting of a supply, usually a controlled
medication. Y - Yes, N - No.
|
|
|
|
|
|
Users Folder
|
|
|
|
|
|
|
Field Name
|
Formats
|
Description
|
|
|
Access Description
|
|
Text Description of the User's Access rights.
|
|
|
User Login Name
|
|
A name that defines a user uniquely to the MedSelect
system.
|
|
|
Created by User Last, First
|
|
Combined field consisting of the surname and first name of
user that created the account.
|
|
|
Profile Description
|
|
Text description of the profile (i.e. RN, LPN,
Administrator).
|
|
|
User Card #
|
|
The number required to log in to a Display Terminal. The number may be encoded on a magnetic or
bar coded card.
|
|
|
User Disabled Login Flag
|
0-9, Y
|
A value of Y indicates that this user account is no longer
an active account, therefore the user may not login to either the AWS or the
DT. A numeric value indicates the
number of consecutive times this user has tried to login and has failed.
|
|
|
User Last, First
|
|
Combined field consisting of a user's surname and first
name.
|
|
|
User First Name
|
|
The first name or initial of an authorized user of a
MedSelect system.
|
|
|
User Last Name
|
|
The surname of an authorized user of a MedSelect system.
|
|
|
User Middle Name
|
|
The middle name or initial of an authorized user of a
MedSelect system.
|
|
|
User Name Prefix
|
|
Titles, such as Dr., Mr., Ms., etc.
|
|
|
User Name Suffix
|
|
Descriptors that would normally follow a name, such as
Jr., III. MD., Ph.D., etc.
|
|
|
User Status
|
A, I
|
Flag indicating whether the user has been marked as
deleted in the system. Inactive users
are retained in the system for reporting reasons only. A - Active, I - Inactive
|
|
|
Current Users
|
|
Retrieves all users that have not been deleted from the
MedSelect System.
|
|
|
Disabled Users
|
|
Retrieves all users that have their login access disabled.
|
|
|
Deleted Users
|
|
Retrieves all users that have been deleted. For data integrity users are not physically
deleted if they have events associated with them.
|
|
|
Centrack Users
(Centrack Catalog Login ONLY)
|
|
Retrieves all users with the following access rights: Centrack Discrepancy Resolution, Centrack
Audit, Centrack Witness or Centrack Login.
|
|
|
|
|
|
|
|
User by Department
subfolder (Parent folder Users)
|
|
|
Department Expiration Date
|
|
The date and time the user account will expire preventing
access to the MedSelect systems in this department.
|
|
|
Witness Name
subfolder (Parent folder Users)
|
|
|
User / Witness
|
|
Combined field consisting of user surname and first name
and the witness surname and first name.
|
|
|
Witness First Name
|
|
First name of the user who logged in as a witness.
|
|
|
Witness Last Name
|
|
Surname of the user who logged in as a witness.
|
|
|
Witness Last, First
|
|
Combined field consisting of the witness surname and first
name.
|
|
|
Witness Middle Name
|
|
Witness’s middle name or initial.
|
|
|
Witness Name Prefix
|
|
Witness's title, such as Dr., Mr., Ms., etc.
|
|
|
Witness Name Suffix
|
|
Witness's title descriptors that would normally follow a
name, such as Jr., III. MD., Ph.D., etc.
|
|
|
|
|
|
Prompts Folder
|
|
|
|
|
|
|
Field Name
& Prompts
|
Formats
|
Filter Examples
|
|

|
Begin
Range Date
|
|
Event Date >= Begin
Range Date and Event Date <= End Range
Date
|
|
|
End
Range Date
|
|
|
|
Expiration Date Prompt
|
|
Pos. Nearest Expiration Date <= Expiration Date Prompt
|
|
|
Visit Created By
|
|
decode ( Visit Created By , 'A', 'AWS' ,'D' ,'Display
Terminal' ,'I' ,'Interface ) = ( Visit Created By: )
|
|

|
Visit Created By:
|
|
|
|
Cabinet Location
subfolder (Parent folder Prompts)
|
|
|
Cabinet Location Prompt Key
|
|
Cabinet Location Prompt Key in (Cabinet Locations) or
Cabinet Location Prompt Key = (Cabinet Locations)
|
|
|
Cabinet Locations
|
|
|
|
|
|
|
|
|
Display Terminal's
Location subfolder (Parent folder Prompts)
|
|
|
DT's Location Prompt Key
|
|
DT's Location Prompt Key in (DT's Location) or
DT's Location Prompt Key = (DT's Location)
|
|
|
DT's Location
|
|
|
|
|
|
|
|
|
Patient Usage
Report subfolder (Parent folder Prompts)
|
|
|
Patient ID #
|
|
This prompt asks for a Patient ID # and then creates a
report that lists all visits for the typed in ID #. Patient ID # = Patient ID Type In:
|
|
|
Patient ID Type In:
|
|
|
|
|
Patient Usage Prompt Key
|
|
This prompt uses the above patient/visit list (see
cascading prompts in the online Help).
Patient Usage Prompt Key = Patient and Visit Picklist.
|
|
|
Patient and Visit Picklist
|
|
|
|
|
|
|
|
|
|
Physician Usage
Picklist subfolder (Parent folder Prompts)
|
|
|
Physician Usage Prompt Key
|
|
Physician Usage Prompt Key in (Physician Picklist) or
Physician Usage Prompt Key = (Physician Picklist)
|
|

|
Physician Picklist
|
|
|
|
|
Staff Names
subfolder (Parent folder Prompts)
|
|
|
Staff Prompt Key
|
|
Staff Prompt Key in (Current Staff) or
Staff Prompt Key = (Current Staff)
|
|
|
Current Staff
|
|
|
|
|
Supply Generic Name
subfolder (Parent folder Prompts)
|
|
|
This prompt may be used for Inventory or Usage
reports.
|
|
|
Supply Prompt Key
|
|
|
|
|
Supply Generic Name
|
|
Supply Prompt Key in (Supply Generic Name) - Lists all
Supplies.
|
|
|
DEA Generic Supply List
|
|
Supply Prompt Key in (DEA Generic Supply List) - Lists
all DEA Supplies.
|
|
|
|
|
|
Prompts for Centrack (Centrack Catalog
Login ONLY)
|
|
|
|
|
|
|
Field Name
& Prompts
|
Formats
|
Filter Examples
|
|
|
Inv. DEA Schedule Key
|
|
Use this key to prompt the user for the DEA Schedule for
Inventory Reports.
|
|
|
DEA Schedule Key
|
|
Use this key to prompt the user for the DEA Schedule for
Usage Reports.
|
|
|
DEA Picklist
|
|
Inv. DEA Schedule Key in ( DEA picklist) or
DEA Schedule Key in ( DEA picklist )
|
|
|
All or Just Those Supplies
|
|
All or Just Those Supplies = 'ALL' or Centrack Supply
Prompt Key in ( Centrack supply
Picklist )
|
|
|
All or Just Those Locations
|
|
All or Just Those Locations = 'ALL' or Cabinet Location
Prompt Key in (Cabinet Locations)
|
|
|
Centrack Users Prompt Key
|
|
|
|
|
Centrack Users
|
|
Centrack Users Prompt Key in (Centrack Users)
|
|
|
Centrack Supply Prompt Key
|
|
|
|
|
Centrack Supply Picklist
|
|
Centrack Supply Prompt Key in (Centrack Supply Picklist)
|
Stay within: Controlled Substance Archive
|
|
This folder enables the user to view all Controlled
Substance activity that have occurred during the past 3 years. Using the data in the events folder only
permits the viewing of 1 year of activity.
Reports should not be built using this folder if the desired data is
within 1 year.
|
|
|
|
|
|
|
|
Field Name
|
Formats
|
Description
|
|
|
Narcotics Patient ID #
|
|
A number assigned by the facility to uniquely identify a
patient.
|
|
|
Narcotics Patient Last, First
|
|
Combined field consisting of a patient’s surname and first
name.
|
|
|
Narcotics Patient Room #
|
|
Location in which the patient resides.
|
|
|
Narcotics Patient Bed #
|
|
A value which distinguishes each location within a room.
|
|
|
Narcotics Item Code
|
|
The number assigned by the facility (at the time the event
was written to the database) to uniquely identify a supply. For medications, this is the facility
formulary number.
|
|
|
Narcotics Trade Name
|
|
The proprietary name protected by US Trademark for a
supply.
|
|
|
Narcotics Generic Name
|
|
The non-tradename for a supply or the chemical name for a
medicine.
|
|
|
Narcotics Generic Name,Strength,Size,Units
|
|
Combined field consisting of Supply Generic Name,
Strength, Size and Units.
|
|
|
Narcotics Supply Size
|
|
The per unit amount of a supply (e.g. 400 units).
|
|
|
Narcotics Supply Units
|
|
The measurement used with a dose size.
|
|
|
Narcotics Supply Size and Size Units
|
|
Combined field consisting of Supply Size and Size Units.
|
|
|
Narcotics Supply Strength
|
|
Application Strength of the prescribed medication.
|
|
|
Narcotics DEA Schedule
|
1, 2, 3, 4, 5
|
A Drug Enforcement Agency defined class of drug.
|
|
|
Narcotics Defined Class Desc.
|
|
Text describing the customer defined class assigned to
this medication.
|
|
|
Narcotics Event Date
|
|
The date and time the event occurred.
|
|
|
Narcotics Qty
|
|
Quantity of the
supply effected by the event. (e.g. quantity taken, returned, stocked or
wasted).
|
|
|
Narcotics Event Status Desc.
|
|
Text describing the status of the event (ie: Taken,
Returned).
|
|
|
Narcotics Supply Position Desc.
|
|
Description of the supply position where the narcotic was
dispensed. This description includes
the name of the cabinet and the location of the supply within the cabinet.
|
|
|
Narcotic User Last, First
|
|
Combined field consisting of a user’s surname and first
name.
|
|
|
Narcotics Physician Last, First
|
|
Combined field consisting of the ordering physician’s
surname and first name.
|
|
|
Narcotics Witness Last, First
|
|
Combined field consisting of the witness’s surname and
first name.
|
|
|
Narcotics Unique Generic Name
|
|
Unique Combined field for grouping and sorting by Generic
Name.
|
|
|
Narcotic Unique
|
|
Unique key field for grouping.
|
|
|
|
|
|
Stay within: Kits
|
|
|
|
|
|
|
Field Name
|
Formats
|
Description
|
|
|
Kit Name
|
|
A name that describes the group of supplies (e.g. Gall
Bladder kit).
|
|
|
Kit
Department Name
|
|
This field determines on which DT's the kit will be
displayed.
|
|
|
Kit Most Restrictive DEA
|
|
This field contains the most restricted DEA of all the
supplies that are contained within the kit.
|
|
|
Kit Supply Generic Name, Strength, Size, Units, Form
|
|
Combined field consisting of Generic Name, Strength, Size,
Units and Form.
|
|
|
Kit Supply Trade Name
|
|
The proprietary name protected by US Trademark for a
supply.
|
|
|
Kit Supply Size and Size Units
|
|
Combined field consisting of Supply Size and Size Units.
|
|
|
Kit Supply Strength
|
|
Application strength of the prescribed med.
|
|
|
Kit Supply DEA Schedule
|
|
Values "1", "2", "3",
"4", "5", "6", "OTC" and
"Legend".
|
|
|
Kit Defined Class Desc.
|
|
Text describing the customer defined class assigned to
this medication.
|
|
|
Kit Supply Kit Qty
|
|
Quantity of a dose of a specific supply to be included in
the kit.
|
|
|
|
|
|
Stay within: MedOrders
|
|
|
|
|
|
|
M.O. Details
subfolder (Parent folder Stay within: MedOrders)
|
|
|
Field Name
|
Formats
|
Description
|
|
|
M.O. Admin as
Needed or Prescribed
|
|
Values "Administer as needed" or
"Administer as prescribed".
|
|
|
M.O. Admin as
Needed or Prescribed Flag
|
Y,N
|
"Y" indicates that the medication is
administered to the patient as needed. A value of "N" means that the
medication is “straight”, meaning that it is administered as prescribed.
|
|
|
M.O. Comments
|
|
Comments supplied by the pharmacist about a medication
order.
|
|
|
M.O. IV Type
|
|
Values "IV", "SVP","LVP" or
Blank if it is not any type.
|
|
|
M.O. IV Rate
|
|
Amount and Units per time.
|
|
|
M.O. Frequency
|
Default to 1
|
The number of times to administer a medication within a
certain period of time.
|
|
|
M.O. MedOrder #
|
|
A facility system assigned number for a medication order.
|
|
|
M.O. Medication Start Date
|
|
The date and time that a medication order begins.
|
|
|
M.O. Medication Stop Date
|
|
The date and time that a medication order ends.
|
|
|
M.O. Needs Human Review?
|
|
Values "Yes" or "No".
|
|
|
M.O. Needs Human Review Flag
|
Y,N
|
Flag indicating that the MedOrder should be reviewed for
special instructions before the medication is administered.
|
|
|
M.O. Ordering Physician Last, First
|
|
Combined field consisting of ordering physician's surname
and first name.
|
|
|
M.O. Order
Place Date
|
|
The date and time the physician wrote the medication
order.
|
|
|
M.O. Order Receive Date
|
|
The date and time the MedSelect system received the
medication order from an interface.
|
|
|
M.O. Pharmacy Checked
|
|
Text indicating that the medication order has been checked
by a Pharmacist. This field may contain
a name or ID to identify the person who approved the order.
|
|
|
M.O. Prescribed Route Desc.
|
|
Text describing the medication administration route,
prescribed by the ordering physician (e.g. Apply externally, Intravenous).
|
|
|
M.O. Special Instructions
|
|
Any special instructions to be displayed for this
MedOrder.
|
|
|
M.O. Status Desc.
|
|
Text describing the status of the medication order (for
example: Cancelled; Completed; Discontinued; Not Found; On Hold; In-Progress,
Unspecified; Replaced; In-Progress, Scheduled).
|
|
|
|
|
|
|
|
M.O. Status Filters
subfolder (Parent folder M.O. Details)
|
|
|
M.O. Status Key
|
|
Unique key identifying the MedOrder status.
|
|
|
M.O. Cancelled
|
4
|
Retrieves all Cancelled MedOrders.
|
|
|
M.O. Completed
|
5
|
Retrieves all Completed MedOrders.
|
|
|
M.O. Discontinued
|
6
|
Retrieves all Discontinued MedOrders.
|
|
|
M.O. In-Progress, Scheduled
|
11
|
Retrieves all MedOrders with Give Schedules.
|
|
|
M.O. In-Progress, Unspecified
|
9
|
Retrieves all PRN MedOrders.
|
|
|
M.O. Not Found
|
7
|
Retrieves all Not Found MedOrders.
|
|
|
M.O. On-Hold Scheduled
|
8
|
Retrieves all MedOrders with Give Schedules that are
On-Hold.
|
|
|
M.O. On-Hold Unspecified
|
46
|
Retrieves all PRN MedOrders that are On-Hold.
|
|
|
M.O. Replaced
|
10
|
Retrieves all Replaced MedOrders.
|
|
|
|
|
|
|
|
M.O. IV Type
Filters subfolder (Parent folder M.O. Details)
|
|
|
M.O. IV Type Flag
|
I,S,L,Null
|
Flag indicating whether the medication order is for an IV
or Piggyback. (I - IV, S - SAP, L -
LVP, Null - not an IV).
|
|
|
M.O. IV
|
I
|
Retrieves all IV type "IV".
|
|
|
M.O. LVP
|
L
|
Retrieves all IV type "LVP".
|
|
|
M.O. SVP
|
S
|
Retrieves all IV type "SVP".
|
|
|
M.O. Not an IV
|
Null
|
Retrieves all Non IV types.
|
|
|
|
|
|
|
|
M.O. Give Schedule
(Parent folder Stay within: MedOrders)
|
|
|
M.O. Prescribed Date
|
|
Date and time a medication is to be administered. This information is provided by the
interface.
|
|
|
M.O. Dispensed Event Date
|
|
The date and time that the MedOrder event occurs.
|
|
|
M.O. Give Status Desc.
|
|
Values "Given", "Given Late",
"Not Given", "Dismissed", "Due", "Not
Due" or "Missed".
|
|
|
M.O. Give Status
|
G, Blank, L, D
|
Single character indicating the status of the give
schedule (i.e. G=given, Blank=not given, L=Late, D = Dismissed).
|
|
|
M.O. Given User Last, First
|
|
Combined field consisting of user's surname and first
name.
|
|
|
M.O. Dismiss User Last, First
|
|
Combined field consisting of user's surname and first name
that dismissed the give schedule.
|
|
|
M.O. Dismiss Reason Desc.
|
|
Text description of reason given for dismissing the give
schedule.
|
|
|
M.O. Dismissed
|
D
|
Retrieves all MedOrders that were Dismissed (MedOrders
that were removed from the DT screen).
|
|
|
M.O. Due
|
Calculated
|
Retrieves all MedOrders whose prescribed time is currently
within the Due Window.
|
|
|
M.O. Given Late
|
L
|
Retrieves all MedOrders that were Given Past the Due
Window.
|
|
|
M.O. Given within Due Window
|
G
|
Retrieves all MedOrders that were given within the due
window.
|
|
|
M.O. Missed
|
Calculated
|
Retrieves all MedOrders whose prescribed time is past the
due late window.
|
|
|
M.O. Not Due
|
Calculated
|
Retrieves all MedOrders whose prescribed date is before
the due window (will not be visible at the DT).
|
|
|
|
|
|
|
|
M.O. Due Window
(Parent folder M.O. Give Schedule)
|
|
|
M.O. Due Window
|
|
The delta time surrounding a medication order give time in
which the dose is considered to be due.
|
|
|
M.O. Due Late Window
|
|
The delta time after the medication give time in which the
medications can be dispensed but will be marked late. After the lateWindow delta time has passed,
the medication will no longer be displayed in the GiveSchedule Browser at the
DT.
|
|
|
Due_Grace_Interval
|
|
Calculated fields used to determine whether a MedOrder is
Due, Missed or Late.
|
|
|
Due_Late_Grace_Interval
|
|
|
|
Start of Due Window
|
|
|
|
End of Due Window
|
|
|
|
Start of Due Late Window
|
|
|
|
End of Due Late Window
|
|
|
|
M.O. Patient and Visit
Information (Parent folder Stay within: MedOrders)
|
|
|
M.O. Admission Height
|
|
The patient's weight at the time of admission.
|
|
|
M.O. Admission Weight
|
|
The patient's height at the time of admission.
|
|
|
M.O. Bed #
|
|
A value that distinguishes each bed in a location.
|
|
|
M.O. Last Name Patient ID# Unique
|
|
Combined field of the patient's surname and ID#. Use when grouping and sorting by patient's
surname.
|
|
|
M.O. Medical Record Number
|
|
A facility assigned number associated with a patient’s
facility records.
|
|
|
M.O. Patient Age
|
|
The patient's age.
|
|
|
M.O. Patient Allergies
|
|
A list of known patient allergies to drugs.
|
|
|
M.O. Patient Birth Date
|
|
The date the patient was born.
|
|
|
M.O. Patient Class
|
I, O, E, P, R
|
How a patient was admitted into the facility (e.g. I-
in-patient, O - out patient, E- emergency, P - pre-admit, R - Reoccurring).
|
|
|
M.O. Patient Class Desc.
|
|
Text description of M.O. Patient Class. Values "In-Patient",
"Out-Patient", "Emergency", "Pre-Admit",
Re-Occurring.
|
|
|
M.O. Patient Created by Desc.
|
|
Indicates which application created the visit record. Values "AWS", "Display
Terminal" or "Interface".
|
|
|
M.O. Patient Gender
|
M, F, O, U
|
Male, Female, Other and Unknown.
|
|
|
M.O. Patient ID#
|
|
A number assigned by the facility to uniquely identify a
patient.
|
|
|
M.O. Patient Last, First
|
|
A patient's surname and first name.
|
|
|
M.O. Patient Room/Bed
|
|
Combined field of the patients room and bed #.
|
|
|
M.O. Patient Room Number
|
|
A patient's location or room, to the MedSelect system.
|
|
|
M.O. Unique Patient
|
|
Unique patient field for grouping.
|
|
|
M.O. Visit #
|
|
Unique number assigned by the facility for a patient
visit.
|
|
|
M.O. Visit Status Desc.
|
|
The current status of a visit at a point in time. Values “Open”, “On-Hold”, and “Closed”.
|
|
|
|
|
|
|
|
M.O. Visit Status
Filters (Parent folder M.O. Patient and Visit Information)
|
|
|
M.O. Visit Status
|
|
Unique key identifying the MedOrder status.
|
|
|
M.O. Open Visits
|
1
|
Retrieves all patients with Open Visits.
|
|
|
M.O. On-Hold Visits
|
2
|
Retrieves all patients with On-Hold Visits.
|
|
|
M.O. Closed Visit
|
3
|
Retrieves all patients with Closed Visits.
|
|
|
M.O. Supply (Parent
folder Stay within: MedOrders)
|
|
|
M.O. Item Code
|
|
The number assigned by the facility to uniquely identify a
supply. For medications, this is the
facility formulary number.
|
|
|
M.O. Supply Generic Name, Strength, Size, Units, Form
|
|
Combined field consisting of Supply Generic Name,
Strength, Size, Size Units and Form.
|
|
|
M.O. Supply Trade Name
|
|
The proprietary name protected by US trademark for a
supply.
|
|
|
M.O. Supply Size and Size Units
|
|
Combined field consisting of Supply Size and Size Units.
|
|
|
M.O. Dose to Administer
|
|
Dose and Dose Units or the Min and Max Range.
|
|
|
M.O. Dose
|
|
Amount of a medicinal preparation to be administered at
one time.
|
|
|
M.O. Dose Units
|
|
The measurement used with a dose size (e.g. mg, ml, etc).
|
|
|
M.O. Dispense Qty
|
|
Quantity of a dose prescribed by the ordering
Physician. If the quantity is a range
then the interface will set the quantity value to 0 and populate the
MinQuantity and MaxQuantity fields.
|
|
|
M.O. Ordered Supply Form
|
|
The form of a substance (e.g. capsule or tablet).
|
|
|
M.O. Volume
|
|
The total amount of a solution in which a dose is
contained
|
|
|
M.O. Volume Units
|
|
The units associated with the solution in which a dose is
contained.
|
|
|
M.O.
Min Range
Qty
|
|
For range orders, this field will hold the minimum value
in the range.
|
|
|
M.O.
Max Range
Qty
|
|
For range orders, this field will hold the maximum value
in the range.
|
|
|
M.O. Supply Details
(Parent folder M.O. Supply)
|
|
|
M.O. DEA Schedule
|
|
Values "1", "2", "3",
"4", "5", "6", "OTC" and
"Legend"
|
|
|
M.O. Defined Class Desc.
|
|
Facility defined class associated with this supply.
|
|
|
M.O. Supply Cost
|
|
The latest cost of a particular supply.
|
|
|
M.O. Supply Form
|
|
The form of the substance (e.g. capsule or tablet).
|
|
|
M.O. Supply Generic Name
|
|
The non-trademark name for a supply or the chemical name
for a medicine.
|
|
|
M.O. Supply Size
|
|
The per unit amount of a supply (e.g. 400 units).
|
|
|
M.O. Supply Size Units
|
|
The measurement used with a supply size (e.g. mg, ml,
etc).
|
|
|
M.O. Supply Strength
|
|
Application strength of the prescribed med.
|
|
|
M.O. Prompts
(Parent folder Stay within: MedOrders)
|
|
|
Field Name
& Prompts
|
Formats
|
Filter Examples
|
|
|
M.O. Earliest Give Time Prompt Key
|
|
M.O. Earliest Give Time >= M.O. Earliest Give Time.
|
|
|
M.O. Earliest Give Time
|
|
|
|
|
M.O. Status Prompt Key
|
|
M.O. Status Prompt Key in ( M.O. Status Prompt Key).
|
|
|
M.O. Status
|
|
|
|
|
M.O. Visit Status Prompt Key
|
|
M.O. Visit Status = ( M.O. Visit Status).
|
|
|
M.O. Visit Status
|
|
|
|
|
M.O. Medication Stop Date Prompt Key
|
|
M.O. Medication Stop Date Prompt Key >= M.O. Earliest
Stop Date and M.O. Medication Stop Date Prompt Key <= M.O. Latest Stop
Date.
|
|
|
M.O. Earliest Stop Date
|
|
|
|
M.O. Latest Stop Date
|
|
Stay within: Return Drawers Contents
|
|
Field Name
|
Formats
|
Description
|
|
|
Return Cabinet Description
|
|
The Cabinets Description that is associated with the
return drawer.
|
|
|
Return Cabinet Location Number
|
|
The Cabinets Location Number that is associated with the
return drawer.
|
|
|
Return Supply Trade Name
|
|
The proprietary name protected by US trademark for a
supply.
|
|
|
Return Supply Generic Name, Strength, Size, Units, Form
|
|
Combined field consisting of Supply Generic Name,
Strength, Size, Size Units and Form.
|
|
|
Return Unique Generic and Item Code (Use for Grouping)
|
|
Unique Combined field for grouping and sorting by Generic
Name.
|
|
|
Return Supply Generic Name
|
|
The non-trademark name for a supply or the chemical name
for a medicine.
|
|
|
Return Item Code
|
|
The number assigned by the facility to uniquely identify a
supply. For medications, this is the
facility formulary number.
|
|
|
Return Supply Size and Size Units
|
|
Combined field containing Supply Size & Supply Size
Units.
|
|
|
Return Supply Size
|
|
The per unit amount of a supply (e.g. 400 units).
|
|
|
Return Supply Size Units
|
|
The measurement used with a supply size (e.g. mg, ml,
etc).
|
|
|
Return Supply Strength
|
|
Application strength of the prescribed med.
|
|
|
Return Supply Form
|
|
The form of the substance. (e.g. capsule or tablet)
|
|
|
Return DEA Schedule
|
|
Values "1", "2", "3",
"4", "5", "6", "OTC" and
"Legend"
|
|
|
Return Defined Class Description
|
|
Facility defined class associated with this supply.
|
|
|
Return Date
|
|
Date and time the supply was placed in the return drawer.
|
|
|
Return Quantity
|
|
Amount of a supply returned.
|
|
|
Return by User Last, First
|
|
Combined field consisting of returning user's surname and
first name.
|
|
|
Return User First Name
|
|
The first name or initial of the return user of a
MedSelect system.
|
|
|
Return User Last Name
|
|
The surname of the return user of a MedSelect system.
|
Stay within: Supply Inventory
|
|
|
|
|
|
|
Pos. Supply
Assignments subfolder (Parent folder Stay within: Supply Inventory)
|
|
|
Field Name
|
Formats
|
Description
|
|
|
Pos. Cabinet Location Number
|
|
Facility location where the cabinet resides.
|
|
|
Pos. Cabinet Desc.
|
|
Text description of the cabinet.
|
|
|
Pos. Cabinet Status Desc.
|
|
Text description of the Pos. Cabinet Status. Values "Active" or
"Inactive".
|
|
|
Pos. Cabinet Status
|
A, I
|
Flag indicating whether the cabinet is currently in
use. An inactive cabinet is only
stored in the database for reporting reasons.
|
|
|
Pos. Compartment
|
|
Sequential letter identifying the specific compartment in
which a supply resides. Values: A - P.
Sequential number from 1-999 for virtual storage compartments.
|
|
|
Pos. DT's Name
|
|
Text description of the Display Terminal where the cabinet
is assigned.
|
|
|
Pos. Failed Flag
|
Y or Null
|
Indicates that a dispense discrepancy has occurred in this
supply position.
|
|
|
Pos. Is this Position Failed?
|
|
Text description of the Pos. Failed Flag. Values "Yes" or "No".
|
|
|
Pos. Current Qty
|
|
The quantity of a supply occupying a specific supply position.
|
|
|
Pos. Desc. w/ Failed Flag
|
|
Combined field consisting of the Supply Position
Description and an "(F)" if the Position is failed.
|
|
|
Pos. Description
|
|
Description of the supply position (e.g. Unit Dose Module
1 Bin 4, Drawer Module 3 drawer 2 Compartment 12, Cabinet 1 Hook 10, Cabinet
3 Box 1-1).
|
|
|
Pos. Desc. for Sorting
|
|
Use the field to group and sort by the supply position.
|
|
|
Pos. Lot #
|
|
Lot Number to which the medication assigned to the
position belongs.
|
|
|
Pos. MedOrder Override
|
Y or Null
|
If the value is Y then any user with the appropriate DEA
Schedule and CDC rights can override this supply loaded in this
position. If the value is Null and the
supply is marked as MedOrderRequired then it can not be dispensed from the
supply browser unless the user has MedOrder override access rights.
|
|
|
Pos. Maximum Qty
|
|
The maximum amount of a supply that a facility wants to
keep in a particular supply position.
|
|
|
Pos. Minimum Qty
|
|
The minimum amount of a supply that a facility wants to
keep in a particular supply position.
|
|
|
Pos. Nearest Expiration Date
|
|
Date the medication assigned to the position is to expire.
|
|
|
Pos. Date Last Audited
(Centrack Catalog Login ONLY)
|
|
Date & time of the last Centrack audit performed on
this supply.
|
|
|
Pos. Return Drawer Flag
|
I, O or Null
|
Flag indicating drawer can accept returns. I - accepts returns, O- allows retrieval of
returns, blank - does not accept or allow retrieval of returns.
|
|
|
Pos. Status
|
A, I
|
Flag indicating whether this supply position is currently
configured as part of a controller.
All supply positions will be active until the controller is deleted or
the controller configuration changes.
The supply positions affected will be flagged inactive.
|
|
|
Pos. Status Desc.
|
|
Test description of Pos. Status. Values "Active" or
"Inactive".
|
|
|
Pos. Status Key
(SmartStock par level Only)
|
30, 31, 32
|
StatusKey indicating the status of this non-billable
virtual supply position. 31 - Below
Min, 30 - Out of Stock and 32 - Restocked.
Smartstock - (Non-Counted Positions).
|
|
|
Pos. Stock-It Restock Amount
|
|
Quantity to be stocked in a specific position. This field
will be populated by the Centrack application for Centrack supplies and by a
cron job for non-Centrack supplies.
The cron job is to be scheduled and it calculates the amount to
restock the position to it's maximum.
|
|
|
Pos. Type Key
|
48, 49
|
Statuskey indicating whether this position will be tracked
as par level or counted. 48 - Not Counted (par level), 49 - Counted.
|
|
|
Pos. Counted or Not Counted
|
|
Text description of Pos. Type Key. Values "Counted" or "Not
Counted".
|
|
|
Pos. Not Counted Inventory Status (SmartStock par level
Only)
|
|
Text description of the Pos. Status Key. Values "Out of Stock",
"Below Min" or "Restocked".
|
|
|
Pos. Cabinet Status
= 'A'
|
|
Retrieves all cabinets that have not been deleted from the
MedSelect System.
|
|
|
Pos. Counted Med/Supplies
|
49
|
Retrieves all supply positions with a Pos. Type Key of 49.
|
|
|
Pos. No Expiration Date
|
|
Retrieves all supply positions that do not have an
Expiration Date.
|
|
|
Pos. SS Not Counted Med/Supplies (SmartStock par level
Only)
|
48
|
Retrieves all SmartStock supply positions with a Pos. Type
Key of 48.
|
|
|
Pos. SS Not Counted Below Minimum (SmartStock par level
Only)
|
|
Retrieves all SmartStock, not counted positions that were
scanned below minimum.
|
|
|
Pos. SS Not Counted Out of Stock (SmartStock par level
Only)
|
|
Retrieves all SmartStock, not counted positions that were
scanned out of stock
|
|
|
Pos. SS Not Counted Restocked (SmartStock par level
Only)
|
|
Retrieves all SmartStock, not counted positions that were
scanned restocked.
|
|
|
Pos. Past Expiration Date
|
|
Retrieves all supply positions whose expiration date has
passed.
|
|
|
Pos. Position is Available
|
|
Retrieves all supply positions that do not have a supply
assigned.
|
|
|
Pos. Position is Failed
|
|
Retrieves all supply positions that have been failed.
|
|
|
Pos. Qty is Below Minimum
|
|
Retrieves all supply positions that have a current
quantity less than the minimum quantity.
|
|
|
Pos. Return and Retrieve Positions
|
|
Retrieves all supply positions that are flagged as return
or retrieve.
|
|
|
Pos. Status = 'A'
|
|
Retrieves all supply position that have not been deleted
from the MedSelect System.
|
|
|
|
|
|
|
|
Inv. Supplies
subfolder (Parent folder Stay within: Supply Inventory)
|
|
|
Inv. Unique Generic and Item Code (Use for Grouping)
|
|
Unique Combined field for grouping and sorting by Generic
Name.
|
|
|
Inv. Supply Generic Name, Strength, Size, Units, Form
|
|
Combined field containing Supply Generic Name, Strength,
Size, Units and Form.
|
|
|
Inv. Supply Trade Name
|
|
The proprietary name protected by US trademark for a
supply.
|
|
|
Inv. Supply Generic Name
|
|
The non-trademark name for a supply or the chemical name
for a medicine.
|
|
|
Inv. Item Code
|
|
The number assigned by the facility to uniquely identify a
supply. For medications, this is the
facility formulary number.
|
|
|
Inv. Supply Size and Size Units
|
|
Combined field containing Supply Size & Supply Size
Units.
|
|
|
Inv. Supply Size
|
|
The per unit amount of a supply (e.g. 400 units).
|
|
|
Inv. Supply Size Units
|
|
The measurement used with a supply size (e.g. mg, ml,
etc).
|
|
|
Inv. Supply Strength
|
|
Application strength of the prescribed med.
|
|
|
Inv. Supply Form
|
|
The form of the substance. (e.g. capsule or tablet).
|
|
|
Inv. DEA 2 Prime Sort
|
|
Use this field if you would like the supplies to be sorted
first by DEA 2's alphabetically by Generic Name and then all other DEA Schedules
follow alphabetically by Generic Name in ascending order.
|
|
|
Inv. DEA Schedule
|
|
Text description of the Inv. DEA Schedule Key. Values "1", "2",
"3", "4", "5", "6", "OTC"
and "Legend".
|
|
|
Inv. DEA Schedule Key
|
1, 2, 3, 4, 5, 6, 37, 38
|
A Drug Enforcement Agency defined class of drug. 37 = OTC,
38 = Legend.
|
|
|
Inv. Defined Class Desc.
|
|
Facility defined class associated with this supply.
|
|
|
Inv. Supply System Minimum Qty
|
|
The minimum quantity of a supply that a facility wants to
keep in inventory. The supply should
be re-ordered when minimum is reached.
|
|
|
Inv. Supply System Maximum Qty
|
|
The maximum quantity of this supply that should be in
stock. Maximum quantities prevent
over-stocking.
|
|
|
Inv. Supply System Total Qty
|
|
The actual quantity of this supply currently being stored
by MedSelect.
|
|
|
Inv. Supply Cost
|
|
The latest cost of a particular supply.
|
|
|
Inv. Manufacturer Part Number
|
|
The number assigned by a manufacturer to identify a
supply.
|
|
|
Inv. NDC Code
|
|
National Drug Code (NDC) is a pharmacy defined code for
specifying medications.
|
|
|
Inv. Pharmacy Location
|
|
Description of a location within the pharmacy where
medication is located.
|
|
|
Inv. Supply Charge Code
|
|
Hospital code used for billing a supply.
|
|
|
Inv. Vendor #
|
|
Number assigned by the facility which uniquely identifies
the vendor of a supply.
|
|
|
Inv. Accept MedOrders from Interface
|
|
Used for a MedOrder
interface to indicate whether
MedSelect should accept MedOrders for this supply. Values "Yes" or "No".
|
|
|
Inv. Count Remaining Req'd
|
|
Indicates that the supply must be recounted every time a
supply is taken or returned. Values
"Yes" or "No".
|
|
|
Inv. MedOrder Req'd to Dispense
|
|
Indicates that a medication must be in the Patient’s
MedOrder profile before it can be dispensed.
Values "Yes" or "No".
|
|
|
Inv. Centrack Count Remaining (Centrack Catalog Login
ONLY)
|
|
Indicates that the supply must be recounted every time a
supply is taken from or returned to the Centrack System. Values "Yes" or "No".
|
|
|
Inv. Returned to Original Drawer
|
|
Indicates whether this supply is to be returned to its
original drawer rather than to the return drawer. This only applies to supplies assigned to
non-UDM positions. Values "Yes"
or "No".
|
|
|
Inv. Waste Witness Req'd
|
|
A customer option that indicates that a second user must
login to witness the wasting of a supply, usually a controlled
medication. Values "Yes" or
"No".
|
|
|
Inv. Send to Billing Interface
|
|
Indicates whether dispenses of this supply should be sent
to the billing interface. Values
"Yes" or "No".
|
|
|
Inv. Centrack Supplies Only (Centrack Catalog Login ONLY)
|
|
Retrieves supplies that are stocked in the Centrack Vault.
|
|
|
|
|
|
|
|
Inventory Supply
Flags subfolder (Parent subfolder Inv. Supplies)
|
|
|
Inv. Accept Med Orders Flag
|
A, I
|
Used for a MedOrder interface to indicate whether
MedSelect should accept MedOrders for this supply. A - Yes, I - No.
|
|
|
Inv. Billing Flag
|
B, N
|
Character indicating whether supply is billable or
nonbillable. B - billable, N - nonbillable.
|
|
|
Inv. Centrack Count Remaining Flag
|
Y, Null
|
Flag indicating that the supply must be recounted every
time a supply is taken from or returned to the pharmacy. Y - Yes, Null - No.
|
|
|
Inv. Count Remaining Flag
|
Y, N
|
Flag indicating that the supply must be recounted every
time a supply is taken or returned. Y
- Yes, N - No.
|
|
|
Inv. MedOrder Required Flag
|
Y, N
|
A customer option that indicates that a medication must be
in the Patient’s profile before it can be dispensed. Y - Yes, N - No.
|
|
|
Inv. Return Meds to Drawer Flag
|
Y, N
|
Flag indicating whether this supply can be returned to its
original drawer rather than to the return drawer. This flag does not apply to UDM's. Y - Yes, N - No.
|
|
|
Inv. Tracked by Centrack (Centrack Catalog Login
ONLY)
|
Y, Null
|
Flag indicating that this supply is managed by
Centrack. Y - Yes, Null - No
|
|
|
Inv. Witness Required Flag
|
Y, N
|
A customer option that indicates that a second user must
login to witness the wasting of a supply, usually a controlled
medication. Y - Yes, N - No.
|
|
|
|
|
|
|
|
Supply Type Filters
subfolder (Parent folder Stay within: Supply Inventory)
|
|
|
Centrack (Vault Only) (Centrack Catalog Login
ONLY)
|
|
Retrieves all supplies defined in the Centrack vault.
|
|
|
Display Terminals
|
|
Retrieves all supplies defined in the MedSelect for
dispensing.
|
|
|
SS+ Display Terminals
|
|
Retrieves all supplies defined in the SupplySource Towers.
|
|
|
|
|
|
|
|
|
|
|
Stay within: SIG Codes
|
|
Field Name
|
Formats
|
Description
|
|
|
SIG User Last to Update
|
|
Combined field consisting of the user’s surname and first
name who last updated this SIG.
|
|
|
SIG Code
|
|
Unique text identifying a facility defined SIG.
|
|
|
SIG Day of Month
|
|
A comma-delimited list of integers that indicate the
day(s) of the month the medication should be administered. (1 – 31)
|
|
|
SIG Day of Week
|
|
A comma-delimited list of integers that indicate the
day(s) of the week the medication should be administrated. (0 – Sunday, 6 –
Saturday)
|
|
|
SIG Default Hours
|
|
The default string of administration times in military hours
associated with this SIG. (i.e.
0800,1400)
|
|
|
SIG Repeat Interval
|
|
The number of hours indicating how often the sequence of
give records is repeated.
|
|
|
SIG Repeat Sequence
|
|
Values “Monthly”, “Daily”, “Weekly” or “Hourly”.
|
|
|
SIG Repeat Code
|
M, D, W, H
|
Single character indicating the repeat sequence for the
give schedules. ( M – monthly, D – Daily, W – weekly, H – Hourly)
|
|
|
SIG Stat
|
Y, Null
|
Flag Indicating whether the medication should be given
immediately. Stat can be combined with
any other SIG.
|
|
|
SIG External Condition
|
Y, Null
|
Flag indicating that this SIG is based on some external
condition (i.e. give if blood pressure drops). It will be treated as a PRN therefore no
give records will be generated.
|
|
|
SIG Last Change Date
|
|
Date and time stamp indicating the last time this SIG was
modified.
|
Stay within: System Configuration
|
|
|
|
|
|
|
Controller
Configuration subfolder (Parent folder Stay within: System Configuration)
|
|
|
Field Name
|
Formats
|
Description
|
|
|
CCI. Display Terminal's Location
|
|
Indicates the default Location the DT is assigned to. When a patient is added at the DT, this is
the patient's assigned location.
|
|
|
CCI. Cabinet Location
|
|
Indicates the Location the cabinet is assigned to.
|
|
|
CCI. Cabinet Desc.
|
|
Text description of the cabinet.
|
|
|
CCI. Controller Address
|
|
Each controller is assigned a unique number for
identification by the MedSelect system.
|
|
|
CCI. Controller Configuration
|
|
Code representing the hardware configuration for this
controller type.
|
|
|
CCI. Controller Sequence #
|
|
Sequential number given to a controller within a
cabinet. This number is used to
display controllers in a logical order (left to right, top to bottom).
|
|
|
CCI. Controller Status Desc.
|
|
Text description on the CCI. Controller Status. Values "Active" or
"Inactive".
|
|
|
CCI. Controller Status
|
A, I
|
Flag indicating whether the controller is active. An inactive controller is only stored in
the database for reporting reasons.
|
|
|
CCI. Controller Type Key
|
|
Unique number identifying to the system a specific storage
device type.
|
|
|
CCI. Controller Type Desc.
|
|
Text description of a storage device type.
|
|
|
CCI. DT's Name
|
|
|
|
|
CCI. Door or Drawer Position Desc.
|
|
Text describing the physical location (i.e. DM1 drawer
2-1).
|
|
|
CCI. Supply Position Desc.
|
|
Text describing the physical location and the compartment
(i.e. DM1 drawer 2-1 A).
|
|
|
CCI. Position Desc. for Sorting
|
|
Use this field for sorting CCI. Supply Position Desc. In
Logical order.
|
|
|
CCI. Cabinet Status
|
A, I
|
Flag indicating whether the cabinet is active. An inactive cabinet is only store in the
database for reporting reasons.
|
|
|
CCI. Cabinet Status
= 'A'
|
|
Retrieves cabinets that have not been deleted from the
system.
|
|
|
CCI. Controller Status
= 'A'
|
|
Retrieves controllers that have not been deleted from the
system.
|
|
|
CCI. Door or Drawer Position = 'A'
|
|
Retrieves supply positions that have not been deleted from
the system.
|
|
|
|
|
|
|
|
CCI. Controller
Types subfolder (Parent folder Controller Configuration subfolder)
|
|
|
CCI. Controller Type Key
|
|
Unique number identifying to the system a specific storage
device type, such as Hook, Register, Unit Dose Module, or Box Register.
|
|
|
CCI. Drawer
|
6
|
Retrieves all non-sensor drawer controllers.
|
|
|
CCI. Electronic Lock
|
11
|
Retrieves all electronic lock controllers.
|
|
|
CCI. Injectable Shelf
|
7
|
Retrieves all injectable shelf controllers.
|
|
|
CCI. Orals/Injectables Shelf
|
8
|
Retrieves all oral/injectables shelf controllers.
|
|
|
CCI. Sensor Drawer
|
10
|
Retrieves all sensor drawer controllers.
|
|
|
CCI. UDM Lock
|
9
|
Retrieves all UDM lock controllers.
|
|
|
Stay within:
Display Terminal subfolder (Parent folder Stay within: Supply Inventory)
|
|
|
DT. DT's Name
|
|
A unique name that identifies each PC on the ethernet
network.
|
|
|
DT. Software Version
|
|
Current software version installed on DT.
|
|
|
DT. Location
|
|
The DT's assigned location.
|
|
|
DT. IP Address
|
|
The unique address associated to this DT which allows the
DT to communicate on the facilities network.
|
|
|
DT. Logging Level
|
0,1,2,3
|
Level of logging currently turned on for a DT.
|
|
|
DT. Mode Command
|
|
A state this DT has been instructed to take (i.e. Active,
Inactive, Offline)
|
|
|
DT. Mode Status
|
|
The current state of the DT (i.e Active, Inactive,
Offline).
|
|
|
DT. Receipt Printer Flag
|
Y,N
|
Indicates whether a receipt printer is attached to the
Display Terminal.
|
Stay within: System Log Messages
|
|
Field Name
|
Formats
|
Description
|
|
|
System Application Desc.
|
|
Application logging the event (e.g. DT, AWS).
|
|
|
System Logging Date
|
|
Date and time the event occurred.
|
|
|
System Logging Desc.
|
|
Descriptive information of event.
|
|
|
System Logging Type
|
|
Descriptive information of action creating the logging
event.
|
|
|
System Window/Interface
|
|
Descriptive information for MedSelect.
|
|
|
Administrative WorkStation
|
|
Retrieves all logged events created by the AWS.
|
|
|
ADT Interface
|
|
Retrieves all logged events created by the ADT Interface.
|
|
|
Centrack
|
|
Retrieves all logged events created by Centrack.
|
|
|
Display Terminal
|
|
Retrieves all logged events created by the Display
Terminal.
|
|
|
MedOrder Interface
|
|
Retrieves all logged events created by the MedOrder
Interface.
|
|
|
Nursing WorkStation
|
|
Retrieves all logged events created by the NWS.
|
|
|
Restocking WorkStation
|
|
Retrieves all logged events created by the RWS.
|
Objective: To view the narcotic usage for just one
nurse. Only retrieve the data needed to
prevent your server from lock-ups.
1.
From MedSelect Examiner, open the Controlled
Substance Archive report.
(From the File menu, select Open, from the Rx Reports folder)
2.
Enter a one-day Date Range.
The Controlled Substance Archive
Report is displayed showing controlled substance usage for one day.
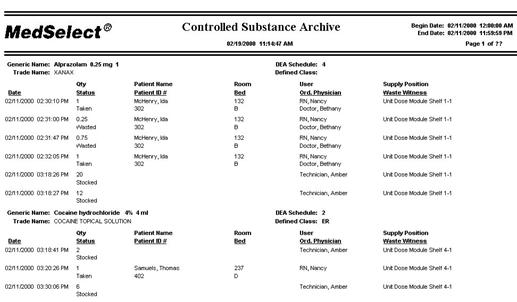
Let's look at the usage for only
one nurse.
3.
Select User Nancy RN so it is highlighted.
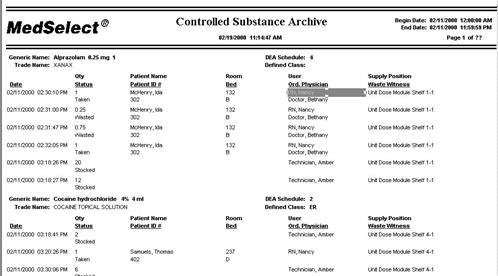
4.
From the Standard
PowerBar, select the Filter
button. 
This report now displays one day
controlled substance usage for Nancy RN only.
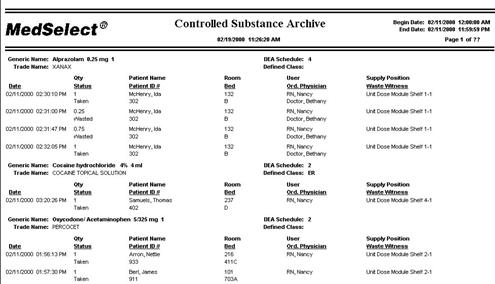
Now let's look at Nancy RN’s
controlled substance activities for the previous 10 days.
5.
From the Standard Power
Bar, select the Prompt
button. 
6.
Enter the Date Range
for the last 10 days.
The report now displays all of
Nancy RN’s controlled substance activities for the previous 10 days.
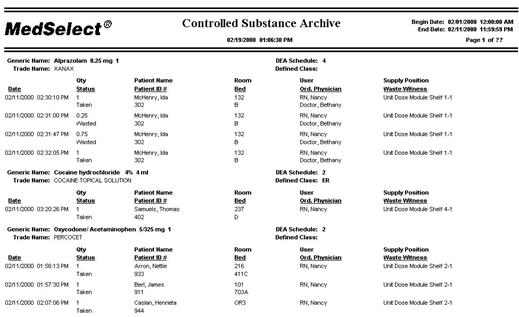
Objective: To schedule a MedSelect Auto report to run
once.
1.
With MedSelect Examiner open, select Tools,
then Scheduler.
The
Scheduler window is displayed.
2.
From the Insert
menu of Scheduler, select Task.
The
Insert Task dialog box is displayed.
3.
Click the Browse
button.
Auto
reports are located at the following path:
C:\Program Files\Cognos\Cer1\Rx
Auto Reports.
4.
Select Out of Stock
(Auto).imr.
5.
Click the Open
button.
The
path of the Out of Stock report is now displayed in the File
Name field.
6.
In the Description field, type the name of the
report: Out
of Stock.
7.
Be sure it is marked to execute on My
Computer.
8.
Select the Timetable
tab.
9.
Schedule the report to run one week from now.
10. Select
the Results tab.
11. Check
the Print option.
12.
In the Printer drop down list, select MedSelect Printer.
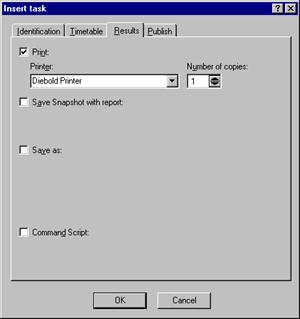
13.
Select OK.
The
task is now scheduled
14.
Minimize the Scheduler application, but do not close Scheduler.
Scheduler must be running for the report to print
automatically. However, you can close
the Examiner application if you wish. If
Examiner is not running when it is time for the report to print, Scheduler will
automatically launch Examiner then open and print the report.
Objective: To schedule the Discrepancy Report to print
daily at 8:00 am for the next month.
1.
With MedSelect Examiner open, select Tools, then Scheduler.
2.
From the Insert
menu of Scheduler, select Recurring Task.
The Insert Task
dialog box is displayed.
3.
Click the Browse
button.
Auto reports are located at the
following path: C:\Program Files\Cognos\Cer1\Rx Auto Reports. However, the discrepancy report is not built
using Examiner, so it does not have an .imr extension like the Examiner
reports. Instead, it has the extension
.exe. By default, only report files with
the .imr extension are displayed, so you will not see the Discrepancy Report
listed. Steps 4 and 5 explain how to
make it visible.
4.
To see all files, open the Files
of Type drop down list.
5.
Select All Files.
The discrepancy executable
is now displayed.
6.
Select discrep.exe.
7.
Click the Open
button.
The
path of the Discrepancy report is now displayed in the File
Name field.
8.
In the Description
field, type the name of the report: Daily Discrepancy Report.
9.
Be sure it is marked to execute on My
Computer.
10.
Select the Timetable
tab.
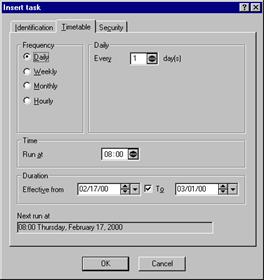
11.
Schedule the report to run daily at 8:00 am beginning
tomorrow and ending one month from today.
12.
Select the OK button.
The
report is scheduled.
Objective: To create folders for custom created reports.
1.
Click on your Windows Start
button in the lower left corner of the screen.
2.
Go to Programs, then Windows Explorer.
3.
Click on the C: drive.
4.
Within the Exploring window, go to File, New,
and Folder.
A new folder is created and waiting
for you to name it.
5.
Type MedSelect
Custom Reports.
6.
Create a second
new folder
7.
Type MedSelect
Scheduled Custom Reports.
Section 2
Demo 2: Hiding Data on a Standard
Report
Objective: To illustrate how to "Hide" and "Show Hidden" information on Examiner standard
reports. This could useful if you wish
to suppress confidential information when sharing reports.
1.
From MedSelect Examiner, open the Supply
Usage Report. (From the File menu, select Open.)
2.
At the Prompt,
enter dates for one month of data, and one or multiple
meds.
3.
Click OK.
The report
displays one month of data.
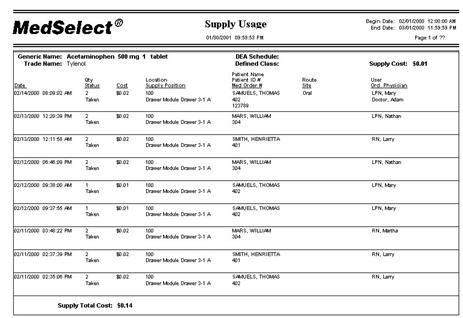
In this
example, we will hide the “User Name”, “Patient ID”, MedOrder Number” and the
associated column header text boxes.
4.
Using the CTRL
key, select the first patient data fields, "Patient Name",
"Patient ID #" and “ MedOrder #”; and the "Patient Name",
"Patient ID #" and “ MedOrder #”, column header text boxes.

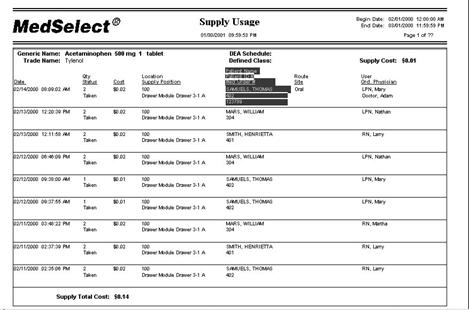
5.
From the Format
menu, select Hide.

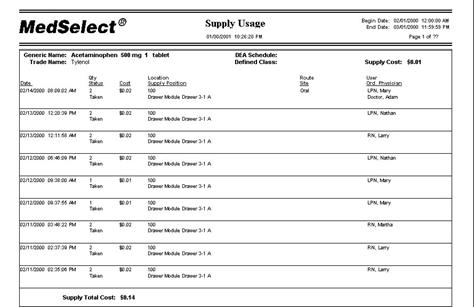
If desired, additional formatting
can be done to make the report more attractive.
To show what data is hidden:
6.
From the View
menu, select Show Hidden.
This shows what
is hidden on this report.


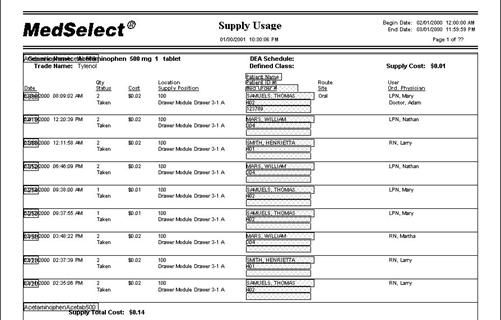
Note: There is more information hidden on this report that what we
just hid. The author of this report used
the Hide feature also.
To undo the Hide
feature:
7.
Using the CTRL
key, select the fields you would like to show

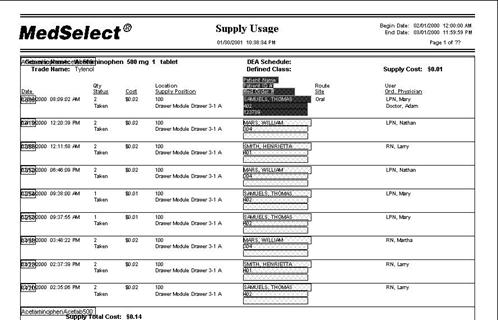
8.
From the Format
menu, select Show.
To not show the hidden fields, turn
off the Show Hidden option.
9.
From the View
menu, select Show Hidden.
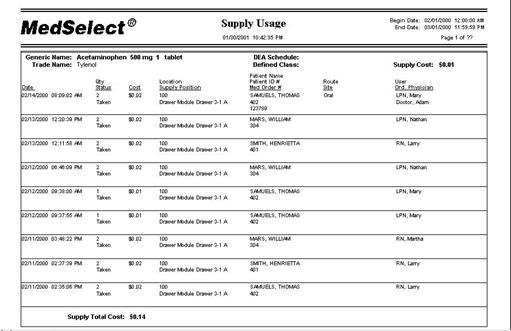
Section 2
Demo 3: Filter a Standard Report
Objective: To filter the Restock Summary standard report
for Narcotics.
1.
From MedSelect Examiner, open the Restock
Summary Report. (From the File menu,
select Open.)
2.
Select Location “100”
3.
At the Prompt,
enter dates for one month of data.
The report
displays one month of restock data.
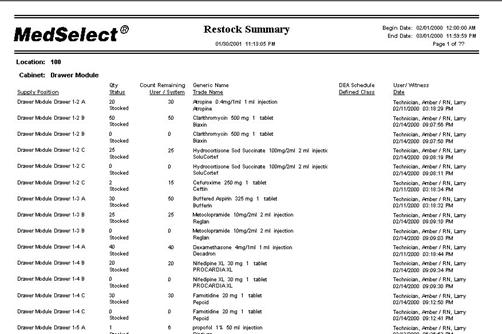
Page down until you find a narcotic.
4.
Select a DEA Schedule.

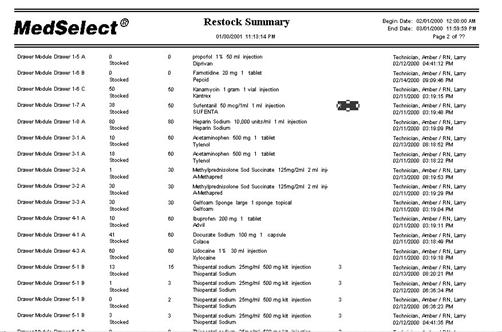
5.
Use the Filter Down Arrow 
Now we would like to select one or
more DEA schedules.
6.
Go to, “In”
and “Select Values”.

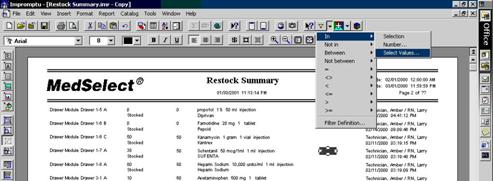
This will allow you to select one
or more value(s).
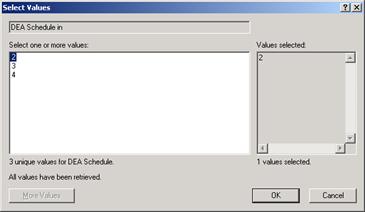
7.
For this example we will ask for Class
2 and 3.
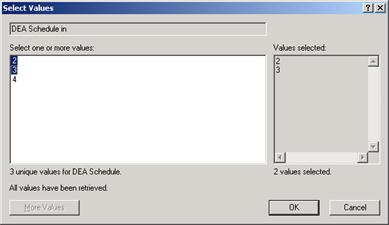
This will give us a report with
only those classes selected.
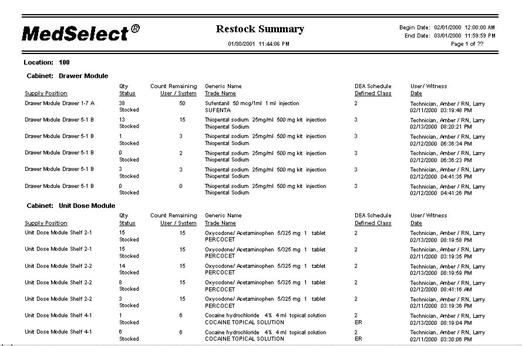
8.
If this were a report you wanted to save you would save
it in you “MedSelect Reports” Folder.
Objective: To create a custom report that displays the
current inventory level stocked at each location, utilizing grouping and
sorting to facilitate reading ease.
1.
From the File
menu, select New.
2.
Select the MedSelect
Landscape template; then
click the OK button.
Decide
what information you need on the report, remember if you use a “Stay-Within” folder you must stay within that
folder.
3.
Select the following data items for inclusion in this
report, these data items are from the “Stay-within: Supply Inventory” folder:
·
Open
the Pos. Supply Assignment
folder, select:
Pos. Cabinet Location Number
Pos.
Description
Pos. Current
Qty
·
Open
the Inv. Supplies folder, select
Inv. Supply Generic Name, Strength, Size, Unit, Form
Inv. DEA
Schedule
4.
Click OK
to close the Query dialog box and
to execute the query.
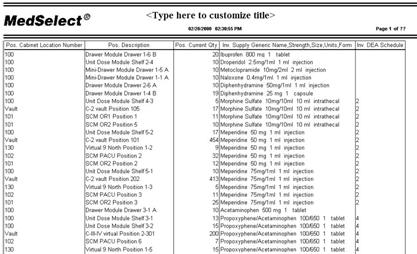
5.
Click on any data item in the Inv
Supply Generic Name, Strength, Size, Units, Form column and drag it to the left of the Pos. Description.
6.
Click on any data item in the Inv
DEA Schedule column and drag
it to the left of the Pos. Description
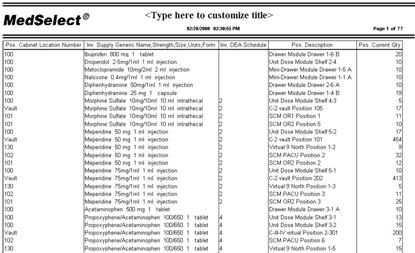
7.
Reopen the Query dialog
box. (From the Report
menu, select Query.)
8.
From the Group tab, select Pos. Cabinet
Location Number, then click on the Group
button.
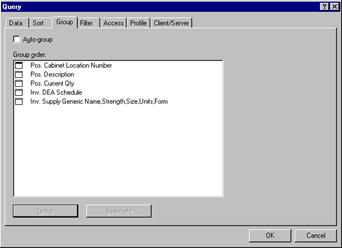
9.
Click OK
to close the Query dialog box and
to execute the defined grouping.
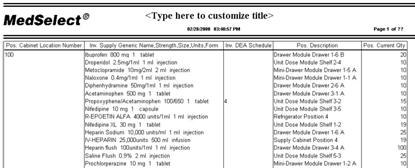
Notice this one grouping makes the
report more readable. However, more can
be done to improve this report’s readability.
Let’s view the name of the medications in alphabetical order to make it
easier to locate a particular medication.
10.
Reopen the Query dialog
box. (select the Query
Data button  on the Standard PowerBar.)
11.
Select the Sort
tab; select Inv. Supply Generic Name, Name,
Strength, Size, Form, then click on the Ascending
button.
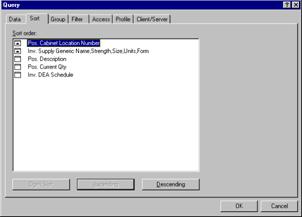
12. Click
OK to close the Query dialog box and to execute the defined sorting
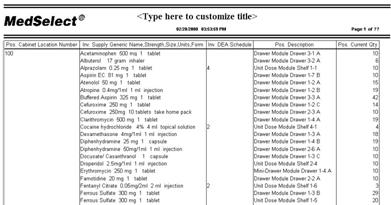
With this simple sorting and
grouping, specific data can be easily found on this report.
To finish this report, it should
display a logical description of the report and then saved to the Custom
Reports folder.
13.
Double click
on the space reserved for the report title, <Type here to customize title>
14.
Delete the
existing text using the Delete key on the keyboard.
15.
Type in a descriptive report title. For this Demo, type in Demo 3-1 Inventory Summary.
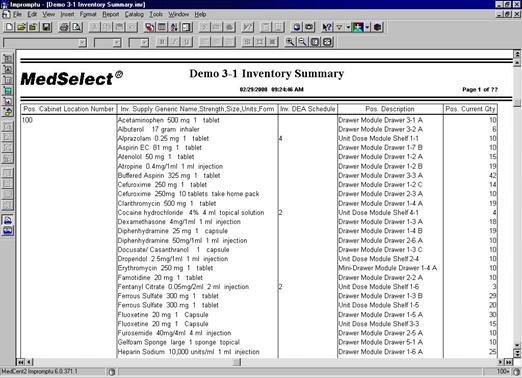
16.
Save
this report in the MedSelect
Custom Reports folder as Demo 3-1
Inventory Summary.
Objective: To create a custom report and illustrate
adding data to a report, then grouping and sorting that data. This report will display the current
inventory cost at each nursing area. We will add onto an existing custom
report.
1.
From the File
menu, select Open.
2.
From the MedSelect
Custom Reports Folder open Demo 3-1
Inventory Summary.
3.
Open the Query dialog
box. (Select the Query
Data button  on the Standard PowerBar.)
Now we need to
add additional information to this report.
4.
Select the folder from where this report was created.
(“Stay-within: Supply Inventory”
folder)
5.
Within the Inv. Supplies
subfolder, select the “Inv. Supply
Cost” data item.
6.
Click OK
to close the Query dialog box and
to execute the query.
You may need to change the size on
the columns to fit all of the data on the width of one page.
7.
Let’s change the width of the Pos.
Cabinet Location Number column. Highlight the title box, place the cursor over
the right handle, once the curser changes to a double arrow, you can drag it to
re-size the width of the entire column.


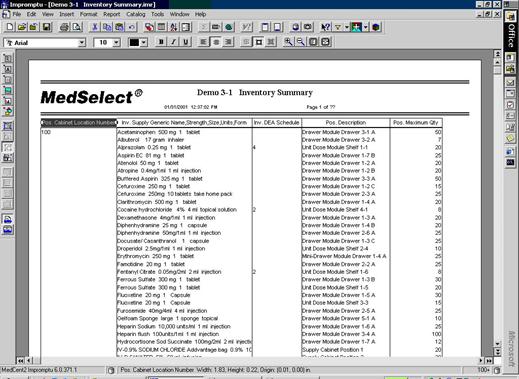
8.
With the title box still highlighted, Right click and edit the text to “Cabinet Location” Hit Esc key.
When we change the width the last
column the “Inv. Supply Cost”
data item will now appear on the same page.

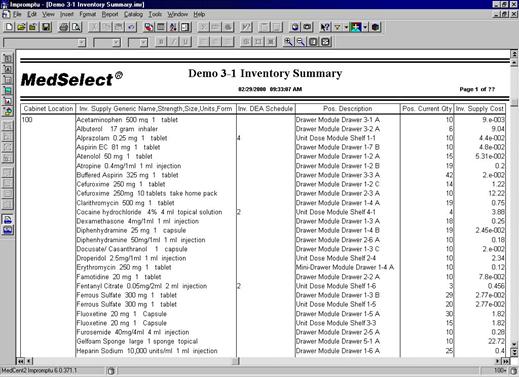
The Inv.
Supply Cost
needs to be formatted properly.
9.
Highlight
the entire column, by placing the cursor at the top of the column until it
turns to a down arrow, and click.


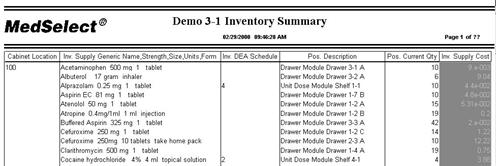
10.
Go to Format,
Data, from the Data tab and the Positive box, select from the drop down menu, “0.00”
Save this report in your MedSelect
Custom Reports folder as “ Demo 3-2
Inventory Costs”, and change the report title to “Demo 3-2 Inventory Costs”.
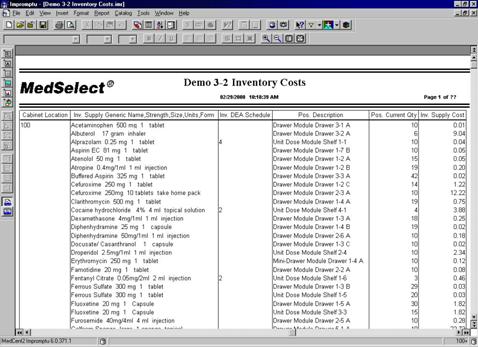
Now we need a calculation to figure
out the cost of the stocked inventory per position.
Let’s display the total cost of
medications in each Location. The
definition of total cost of medications by position, for this example, is the
supply cost times the position quantity (Total Cost =
Supply Cost * Position Quantity).
11.
Open the Query dialog
box. (Select the Query
Data button on the Standard PowerBar.)
12.
From the Data tab
of the Query dialog box, click on
the Calculate button.

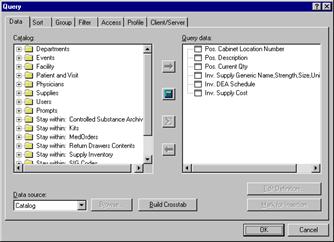
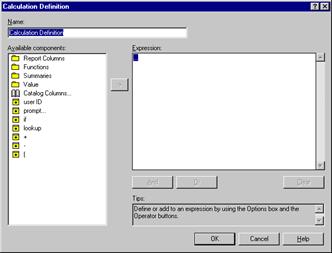
The Calculation Definition dialog box is displayed.
13.
In the Name
text box, type in the name of this calculation, such as Total
Cost.
14.
Open the Report Columns
folder.
15.
Double click on Inv. Supply Cost.
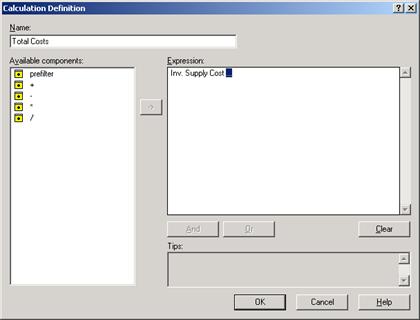
Inv.
Supply Cost
is now displayed in the Expression box.
16.
Double-click on the multiplication
sign ( * ).
17.
Open the Report Column
folder.
18.
Double click on POS. Current Qty.
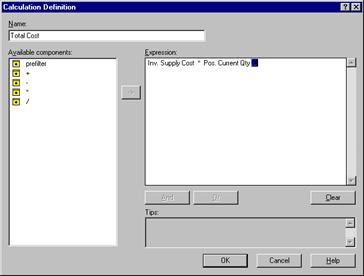
Your calculation is complete.
19.
Click on OK
to accept this calculation description.
This newly created data does not
fit on the width of one page; we need to make one or more columns narrower.
20.
The column width for “Inv.
DEA Schedule” can be changed, Select the column header and Right Click and Select Edit. Delete the Inv. and Schedule; hit Esc.

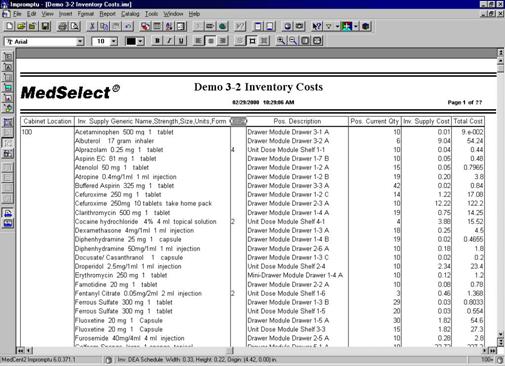
21.
Highlight and format the Total
Cost column to reflect currency.

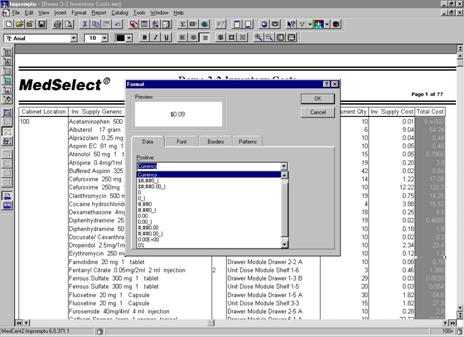
22.
Once selected click OK
at the format window
23.
Save
this report
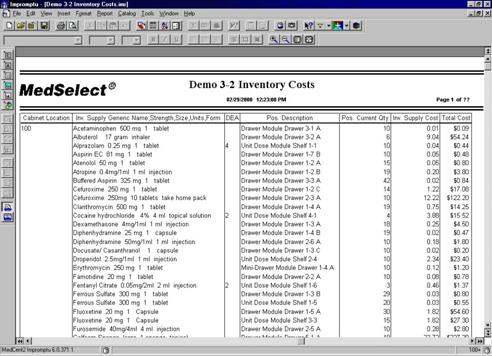
Now we would like a total cost per location.
24.
Place the cursor over the Total
Costs
column that was just created
25.
When the cursor turns into the down arrow, click on
your mouse to highlight the column.
26.
Click the Sum button
 on the Standard
Powerbar.
on the Standard
Powerbar.
Page down, by using the double
arrows in the scroll bar, until you see multiple stations. The SUM function
gave us the sum for each Location.
Now let’s do some additional
formatting to make the report more intuitive to the reader.
27.
Go to the menu bar Insert, Text
Frame. The cursor will carry a box with an A in it. Draw a box next to one of the totals
starting with the upper left corner and drawing it to the lower left corner.
Release the mouse.
28.
Title in the text Location Total
If you wish to do any additional
formatting simply highlight the Text Frame and in this case the Total frame,
right click, go to format. This will allow you to make it bold, change the
size, or color. Any change to one box will change it for the entire report.
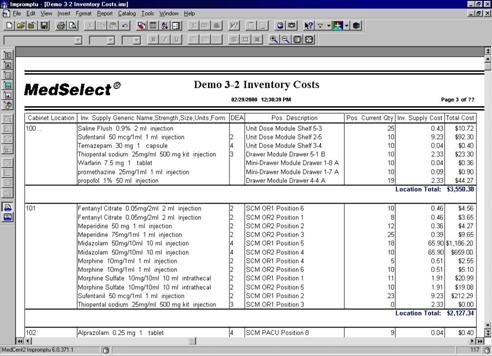
27.
Save
this report.
Objective: Show the principles of how to set the page
breaks on reports.
If you would like to add a page break for
each location:
1.
Open the Saved Report Demo 3-2 Inventory Costs.
2.
Highlight any data item on your report, go to Edit, Select Parent
until all the data on the report is selected. Or use the Select Parent Icon  ,
until the report data is selected.
,
until the report data is selected.
3.
Go to Format,
Properties. or, right click and select Properties.
4.
Page Breaks
are chosen from the List
Properties
dialog box under the Layout tab.
5.
Select the Page break
to meet your need; in this case we will break for each Location.
6.
Position
cursor to icon following Pos. Cabinet Location Number Footer and click to toggle page break on.

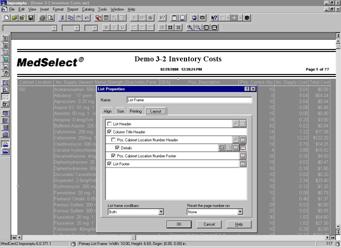
You will now have a page break
for each Location.
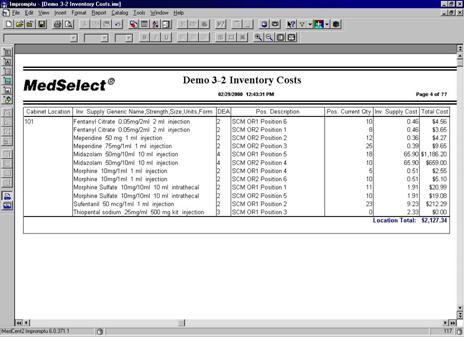
7.
Save this report Demo 3-3 Page Breaks, in the MedSelect
Custom Reports Folder.
Section 4
Demo 1: Prompt Filters
Objective: To create a custom report with a date range
prompt filter using the Portrait Template
Let’s first create a report to look at recent users at any DT.
1.
From the File menu,
select New.
2.
Select the MedSelect
Portrait template.
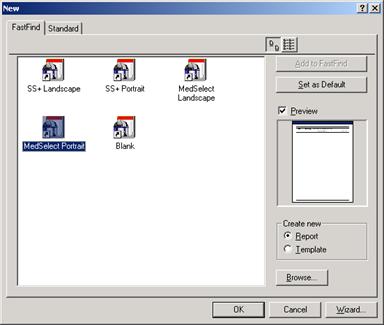
3.
Select the Events folder.
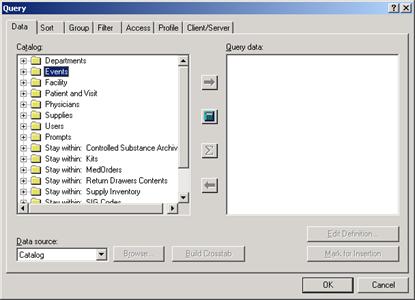
4.
From the Events folder,
select:
·
DT’s Location Number
·
Event Date
·
Quantity
·
Status Desc.
·
User Last, First
5.
From the Users folder,
select:
·
Profile Description
6.
From the Supplies
folder select:
·
Supply Generic Name, Strength, Size, Units, Form
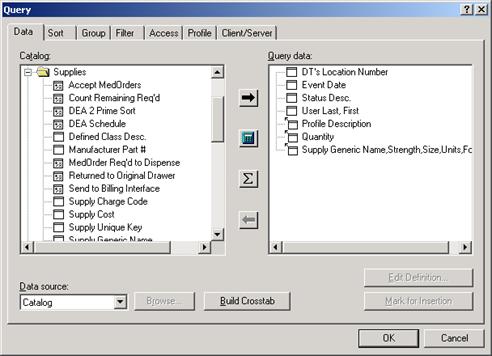
7.
Select the Group Tab,
and group the following:
·
DT’s Location Number
·
Profile Description
·
User Last, First
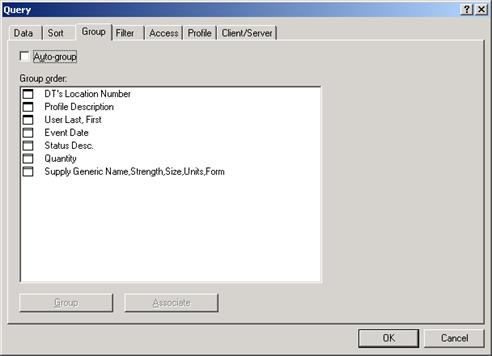
Now let’s create a filter to set
the report to look at User access of the DT for 1 week. In order to obtain the data needed from
database efficiently, it is necessary to use both a detail and summary filter.
The detail filter processes at the
server and the summary filter processes at the PC ensuring maximum processing
speed and minimal pull on the server.
8.
In the Query Dialog
Box select the filter
tab.
9.
Under Report Columns
select Event Date
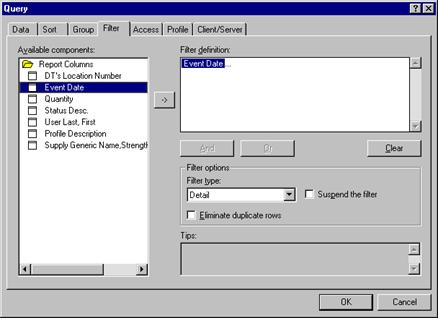
10. Next
select >=.
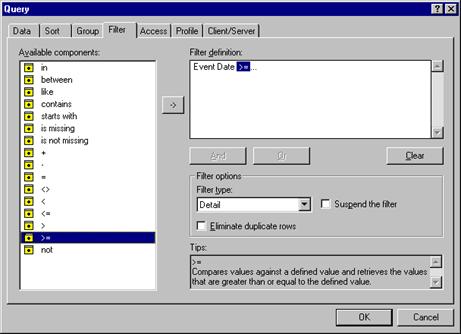
11.
From the Function
list, select Add-Days.
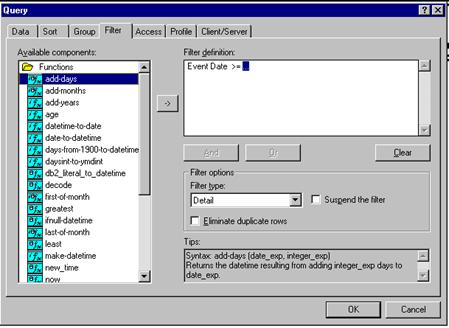
12.
From the Functions
select Now.
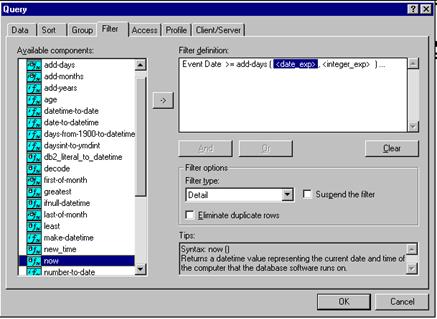
13.
Double
click on Number.
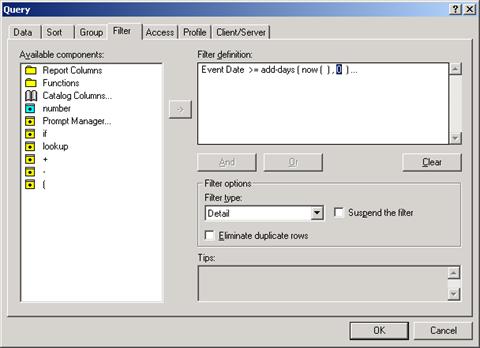
14.
Change the zero to –8.
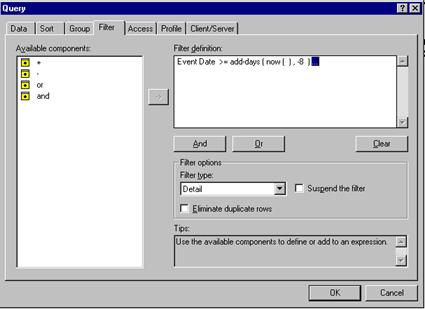
The above filter definition will
retrieve all events from the time the Report was Run {now ()}, to 8 days
earlier.
15.
From Filter options, change the filter type
to Summary.

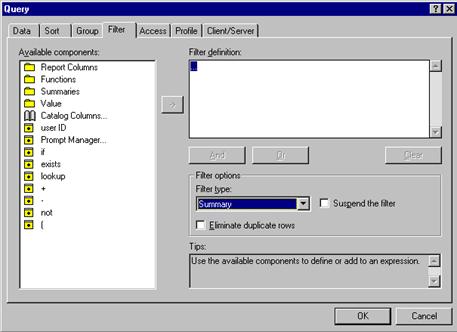
19.
From the Available components box select Report Columns and then Event
Date.
20.
Select >=.
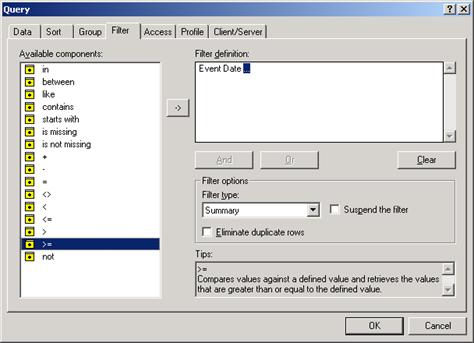
22.
From the Catalog Columns… open the Events
folder. Open Date
Filter Type: DETAIL ONLY.
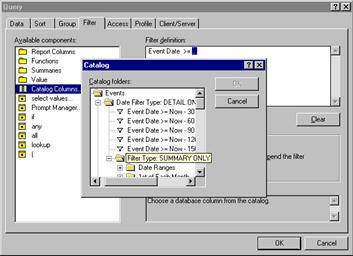
23.
Double click
to open the Filter Type: SUMMARY ONLY. Double click on Date Ranges. Double Click on Previous
7 Days Begin Date to add to report filter. This returns the previous 7 days, from midnight.
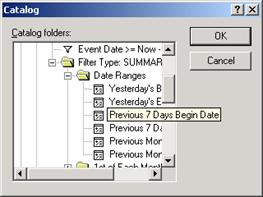
24.
Select AND. Select Report Columns
and double click on Event Date. Double
Click on <=.
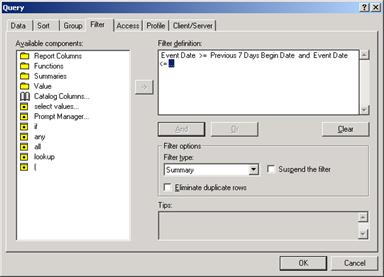
25.
Repeat steps 21 through 23, except this time select Previous 7 Days End Date.
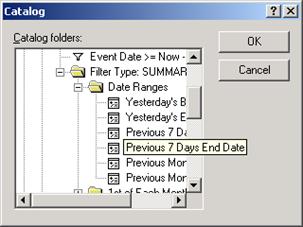
The finished filter expression should look like:
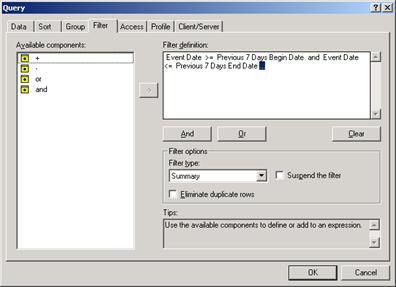
26. Select
OK and run the query.


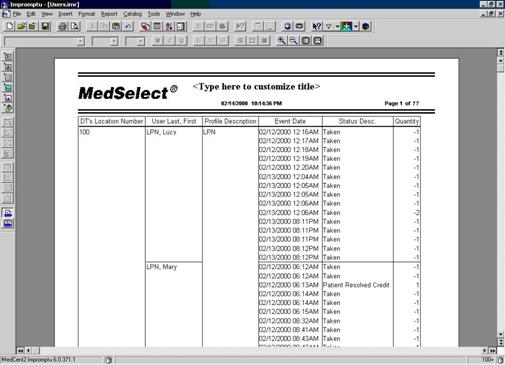
The data elements
contained in the report span more than one page and can be viewed by clicking
on the double right arrows  ,
or selecting screen layout
,
or selecting screen layout  .
.
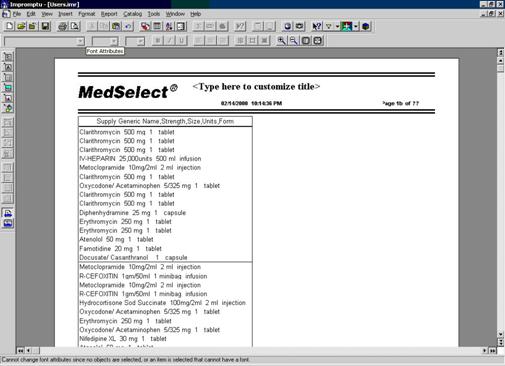
(Second
page
of report, as viewed after
double arrow selection)
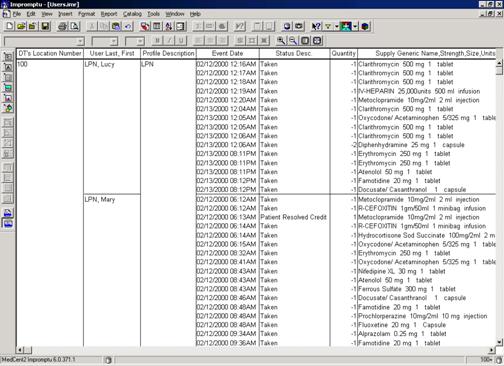
(Screen Layout View)
This report is intended to give the
Nurse Manager and/or Pharmacy a list of any User that accessed the Display
Terminal for that location, therefore, most of the data does not need to be
displayed, although should be retrievable if there is a specific question about
what an individual User may have done at the DT. Therefore most information will be deleted
from the report and accessed only when needed.
27.
To finish this report, select the columns to be deleted
from the report. Holding down the Ctrl key select Quantity,
Supply Generic Name, Strength, Size, Units/Form, Event Date, and Status Desc.
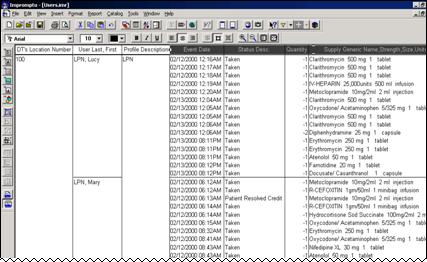
28.
 Use
the Delete Key to eliminate the
columns.
Use
the Delete Key to eliminate the
columns.
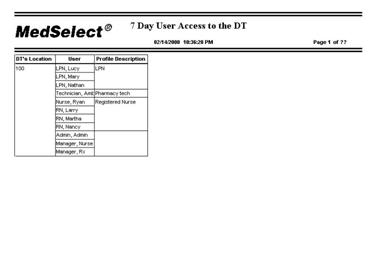
This report now reflects all users
that have accessed this location in the previous 7 days.
29.
Save this Report as 7-Day
User Access to the DT.
If specific information is needed
on dispensing for any user, the information can be easily added back into the
report.
30.
Select the User
in question.

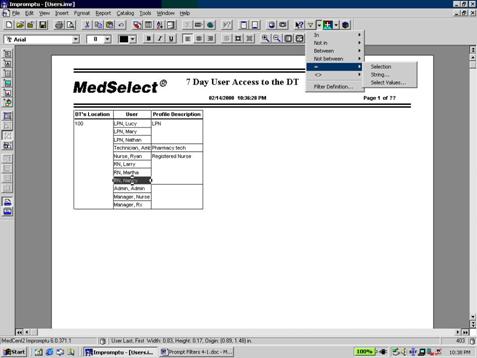
31.
Filter, using the filter icon in the Toolbar. Select = and
Selection.
32.
To add date events back into the Report. From the Query Dialog box double click on Event Date, Status Desc, Quantity, and Supply Generic Name,
Strength, Size, Units, Form.
This marks them for insertion into the report.
33.
Click OK.
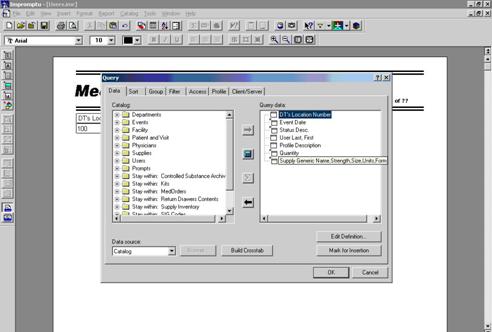
34.
The resulting report displays all dispenses for Nurse
Nancy for the 7-day period.
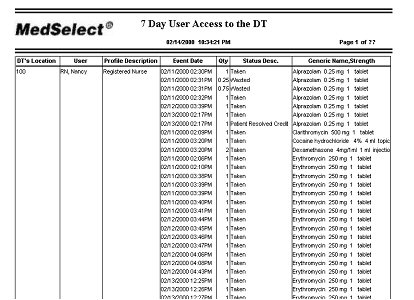
35.
Once the information needed is found, the report should
be closed WITHOUT saving, so that it
reverts back to the original 7-Day Report.

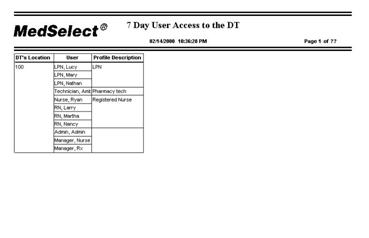
Objective: Write a custom report with a 7-Day Filter
expression, using a previously written report.
1.
Open the 7-Day User
Access to the DT Report.
2.
From Examiner Select New. Select the MedSelect
Landscape, here you will build a date prompt from a previous written
prompt. Click on OK
twice.
3.
From the Menu Bar click on the Window
option, select the 7-day User
Access to the DT.imr and open the Query
Dialog box and Filter
tab.
4.
Highlight the filter expression in the Detail
filter. Right
click and copy.
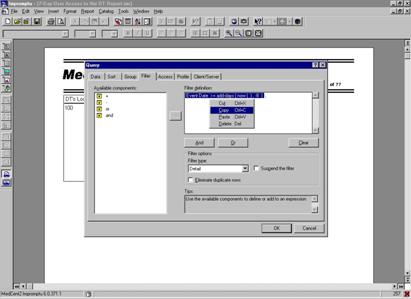
5.
Click on Cancel,
twice. Return (via Window
option) to the new report.
6.
Open the Query Dialog
box and filter expression. Right click
and paste the expression in the
box.
7.
Click OK
twice.
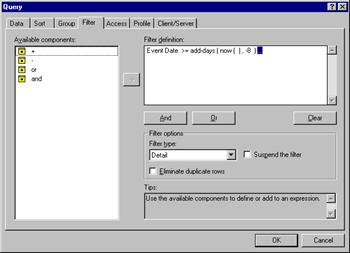
8.
Return to the 7-Day User
Access to the DT.imr report and open Query Dialog box, Filter tab
and select the Summary Filter type from the Filter Type Box.
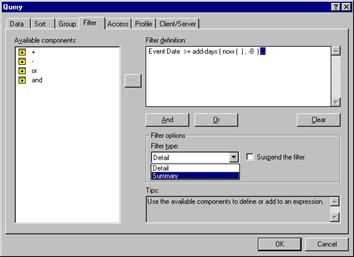
9.
Highlight the expression, Right
click and copy the filter expression.
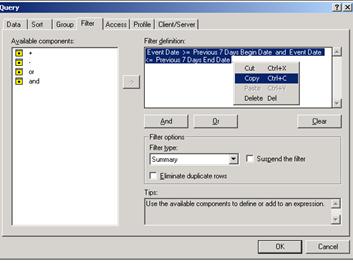
10.
Cancel twice and return to the new report. Open the Query Dialog
box, filter expression box and Summary Filter.
11.
Right click and Paste the expression in the box.
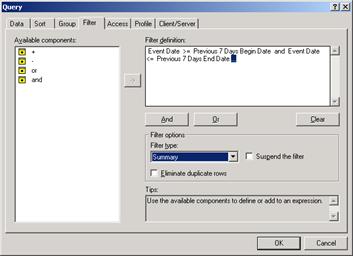
Now let’s get our Data
12.
From the Query Data dialog
box select the Events folder,
and the following data elements:
·
Cabinet Location Number
·
Event Date
·
Quantity
·
Status Desc
·
User Last, First
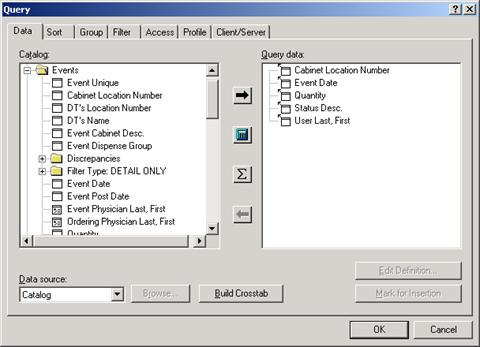
13. From
the Supplies folder add:
·
Supply Generic Name, Strength, Size, Units, Form
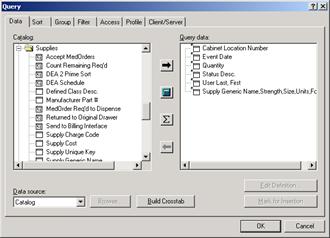
14.
From the Patient
and Visit folder add the Patient Last, First.
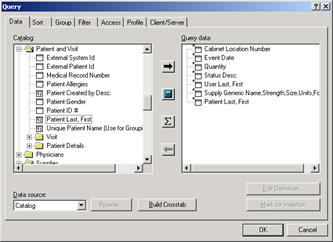
15.
Next, select the Group
tab. Group the following:
·
Cabinet Location Number
·
User Last, First
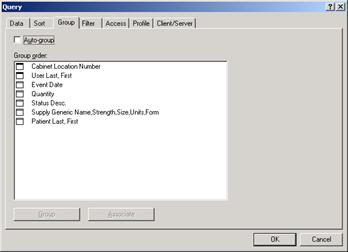
16.
Select the Sort
tab. Notice that Cabinet Location Number and User
Last, First are already sorted.
Select Event Date and Sort Descending. Click OK.
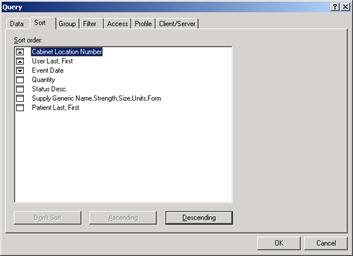
Finally let’s filter the report to only reflect controlled
substances, and clean up the display.
Since we are not printing the DEA Schedule on the Report, we will build
the query from the Catalog Columns.
17.
Open the Query
dialog box, click on the Filter
tab.
18.
Click And,
open the Catalog Columns, then Supplies folder, and double click on DEA
Schedule
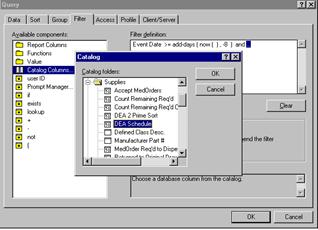
19.
Select the IN
operator and open parentheses ( . Next choose Select Values…
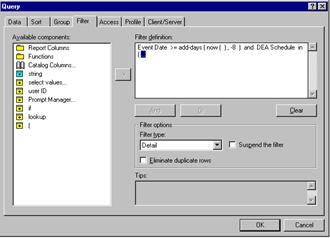
20.
When the Select
Values window opens, select Schedule
2 and 3, by holding down the Ctrl
button and selecting both values.
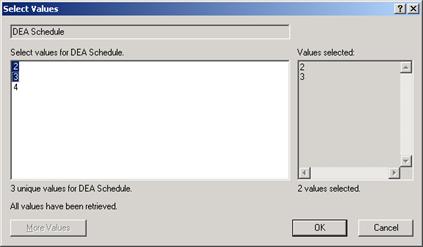
21.
Choose OK.
22.
Select the closed
parenthesis
) to finish the
expression. Click OK to run the query.
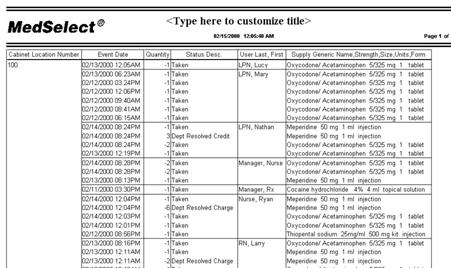
To finish this report, let’s move
the User column next to the Cabinet Location Number and make all
quantities positive numbers.
23.
Select any data element or header in the User column and drag the column to the
left until it is between the Cabinet
Location Number and Event Date.
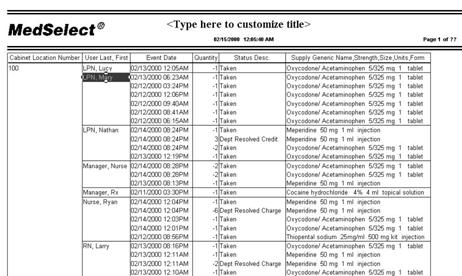
24. To
make all quantities positive numbers it is necessary to do a calculation
involving the quantity column. Open the Query Dialog box and click on the Calculator.

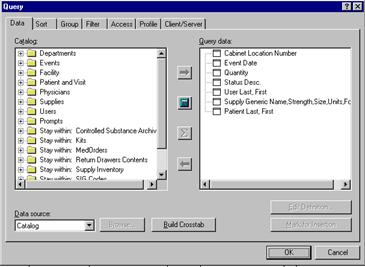
25.
The Calculation
Definition box opens. Define the
Calculation. In this case let’s call it Qty.
26.
Double click on Functions
and then double click on Absolute.
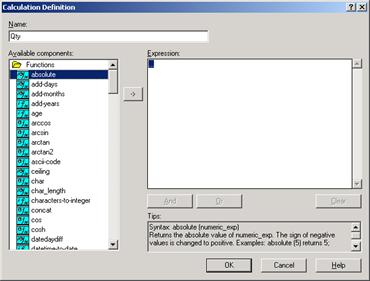
27.
From Report
Columns, select Quantity and
double click, putting it into the calculation
expression box.
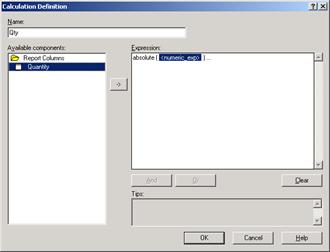
28.
Click OK. Qty
is now a data element in the Query data
box.
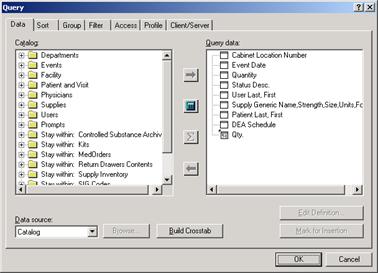
29.
Click OK.
30.
In the report select the Quantity column and delete.
If you do not need
to print the Quantity on the report, you should delete the Quantity from the
Data box to create a more efficient Query.
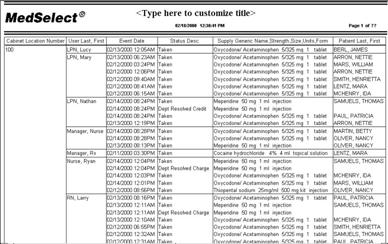

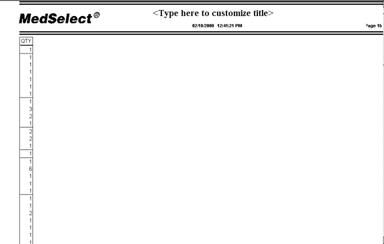
31.
Point the cursor at the entire header row. Change the
Font size to 8 and Bold the headers.


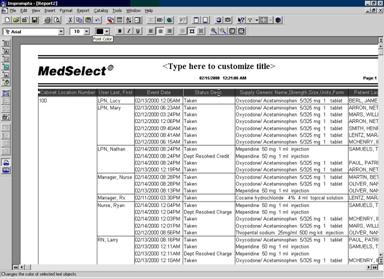
32.
Highlight
the data element row and change it to Font size
8.


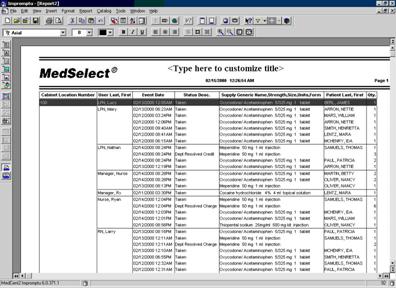
33.
Next let’s clean up the display of the Qty and Status. Open the Query Dialog box and select the calculator again. In the Calculation
Definition box title the calculation Qty
& Status.
34.
Open the Function
folder and select Number –to-String.
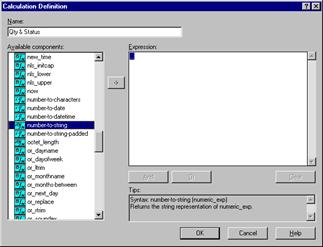
35.
From Report
Columns add Qty (this is the
previously calculated positive quantity).
36.
Select the +,
followed by string. Type two spaces in the string expression, hit
Enter.
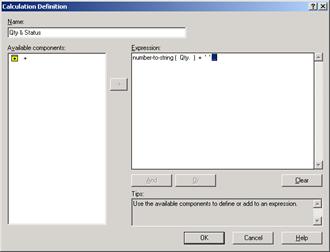
37.
Select +. Finally, from Report Column add the Status
Desc.
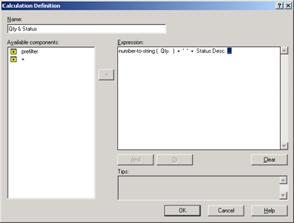
38.
Select OK. The newly created data element will appear in
the Query Data box of the Query Dialog box. Choose OK
again and the Qty & Status will appear in the report in the far left
column, extending over to the next page.
Select the separate values Qty and Status Desc. data elements and Delete.
Once deleted, the
new data element will appear on the report proper.
39. Change
the Font size to 8 and Bold the header
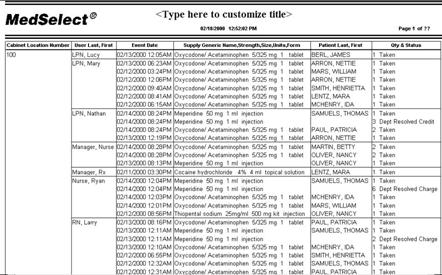
40.
Select the Qty & Status column and drag it over between
Event Date and Supply Generic.

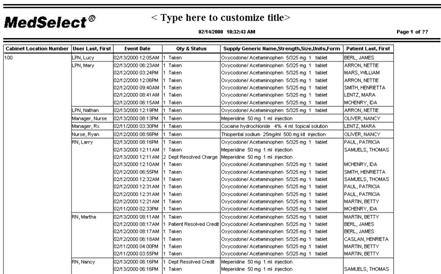
41.
Finally, name the report 7 Day Controlled Substance Report by User and save it, and Close.
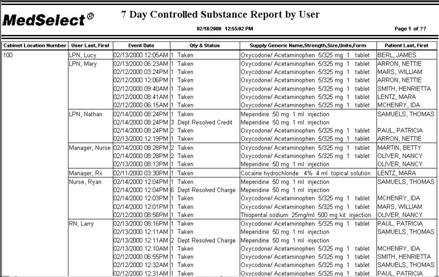
Objective: We will take a
Standard report, and change the date prompt to NOT include minutes and seconds.
1.
From the File menu,
select Open.
2.
Open the Supply
Usage Report from the Rx Reports folder.
3.
Click on Cancel on
the Prompts Dialog box.
4.
Open the Query
Dialog box (Reports, Query or
the Query Button).
First we are going to replace the prompt dates.
5.
Click on the Begin Range Date; Click on the Edit Definition button, the Data
Definition window opens.


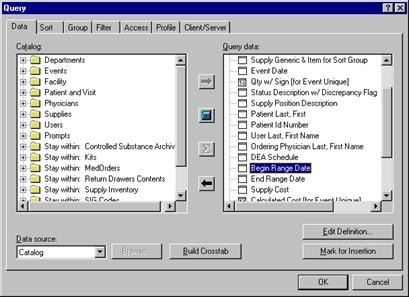
6.
Edit the Name
box to Begin Date.
7.
Click on Begin Range Date in Expression box and delete.
8.
Click on the Prompt
Manager… from the Available
components window.
9.
Click on New.
10.
Name the Prompt
Begin Date.
11.
Leave this a Type
In.
12.
In the Message
field type: Enter the Begin Date…
13.
Data Type should
be Date.
14.
Change the default
date from 2001-01-01 to 2000-01-01 or
to Required Date.


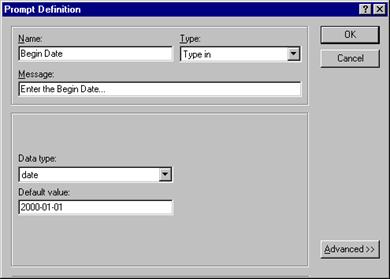
15.
Click OK.
16.
Click OK at
the Prompt Manager Window.
17.
Click OK at
the Data Definition window.
18.
Repeat steps 5-17 for the End Range Date. But for the default date change 2001-12-31 to 2000-12-31 or to Required Date.
19.
Select the Filter
tab in the Query Dialog box, Highlight
Begin Range Date, delete.
20.
Open Report
Columns and select Begin Date.
21.
Do the same for End Range Date.
22.
Click OK.
Your new prompt should look like this:
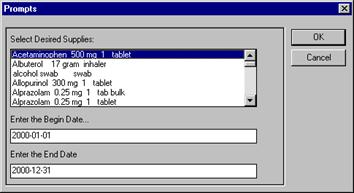
23.
Enter a Date Range.
24.
Click OK.

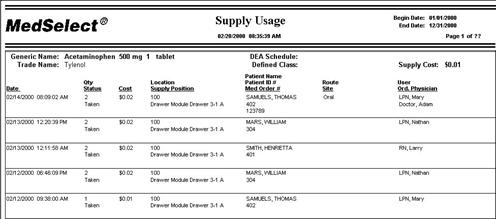
25.
Save this report in the MedSelect Custom Reports Folder as “Changing a Date Prompt”.
Objective: To add
a Report Picklist to a report. In this case we want to add the Location as a
drop down picklist for supply usage information.
Let’s start by using the Report we created for Changing the Date Prompt, Remember this report
started as the Standard Supply Usage
Report.
1.
Open the Changing
a Date Prompt report located in the MedSelect
Custom Reports folder
2.
Select a Medication and a one-day Date Range
3.
Open the Query
Dialog Box (Reports, Query or
the Query Button)
4.
Click on the Filter
tab.
5.
To keep the current filter intact, place parenthesis ( ) before and after the current statement.


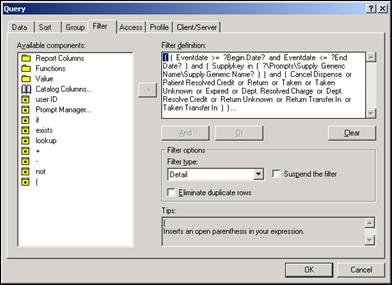
6.
At the ellipsis (…)
add And.
7.
From the Available
Components select Catalog Columns.
8.
Open the Prompts
folder.
9.
Open the Display
Terminal’s Location folder
10.
Select DT’s
Location Prompt Key.
11.
From Available
components, add the in operator
12.
From Available
components, add the open
parentheses ( .
13.
Repeat Steps 7 – 9.
14.
Select DT’s
Location
15.
From Available components add the close parentheses ) .
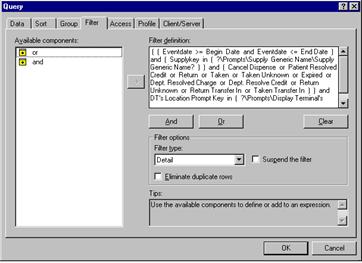
16.
Click OK.
17.
Input a longer Date
Interval.
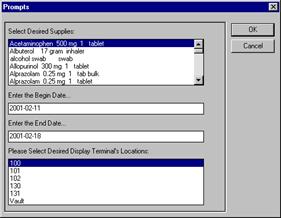
16.
You could select one or Multiple Supplies and
Locations, to do this simply hold down the CTRL
key and click on the desired items. For this Demonstration we will select only
one of each. Click OK.
17.
Rename the
report in the Report header and rename and save the report as Report Picklist Prompt for Location in
the MedSelect Custom Reports Folder.
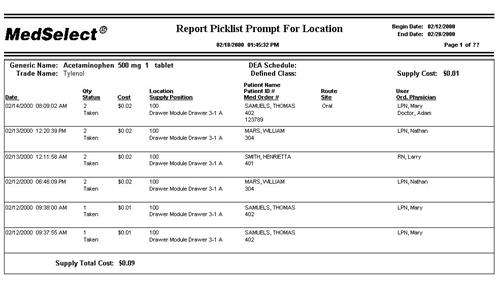
Objective: To modify a Standard Report so that it can be scheduled.
If a report has a Date Range Prompt, it must be modified in order to run the report
automatically at a scheduled time.
Essentially, you are making the report into an Auto report.
1.
Open the
standard report Inventory Returns and Retrieves located at
C:\Program Files\Cognos\Cer1\Rx Reports.

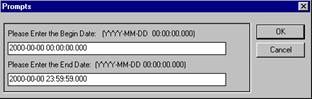
Remember, we cannot modify a standard
report. Therefore, it must be saved
first.
2.
Press the Cancel
button on the Date Prompt box.
3.
Save this
report in the MedSelect Scheduled
Reports folder.
First
let’s replace our Begin Range Date
4.
Open the Query dialog box.
(Select the Query Data button
 on the Standard PowerBar.)
5.
Highlight the Begin
Range Date in the Query Date
box, then click the Edit Definition button.
6.
Highlight the Begin Range Date in the Expression box in
the Data Definition window and delete
it.
7.
Open the Catalog Columns, Events folder, Date Filter
Type: DETAIL ONLY folder, Filter
Type: SUMMARY ONLY and the Date Ranges folder.
Lets say we only want events that occurred
the previous day.
8.
Select Yesterday’s
Begin Date
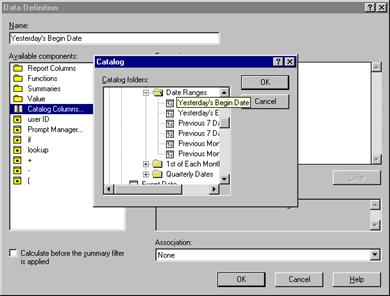
9.
Rename the Name Box to be Yesterdays Begin Date.
10. Click
OK.
11. Repeat
steps 5 – 10 using the End Range Date
and replacing it with Yesterday’s End
Date.
You have just
replaced the Date Fields that print on the Header of the report.
Now let’s remove the
prompts from the Filter box.
13. Select
the Filter tab
14. Highlight Begin Range
Date and Event Date <= End
Range Date and
Delete.
Since we are only going back 1 (one) day we
will create our own expression, rather then the predefined fields in the
Events, Date Filter Type: DETAIL ONLY folder.
15. Open
Functions, select add-days.
16. Open
Functions again, select now.
17. Select number and enter –2.
18. Click
OK.
Our Filter definition no longer has prompts
and will retrieve the Events for the past 2 days.
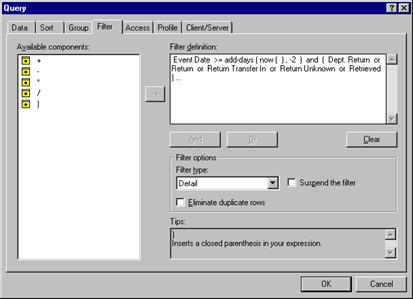
Now we want to add our Yesterdays Begin and
End date to the Summery Detail Filter, to only get the previous day.
19. Open
Query Dialog box, select Filter tab.
20. Choose
Summary Filter type.
21. Open
the Report Columns, select Event Date, select >=.
22. Open
Report Columns, select Yesterday’s Begin Date
23. Select
And
24. Open
Report columns, select Event Date, select <=.
25. Open
Report columns, select Yesterday’s End Date
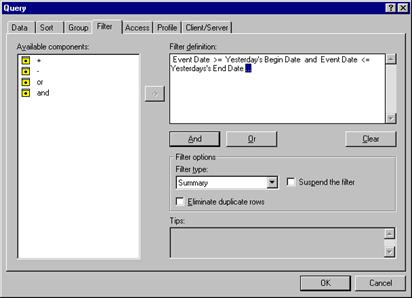
26.
Click OK.
The objective of an auto report is that it
runs at a scheduled time without human intervention. Let’s suppose this report
needs to be run daily. The Filter
definition must contain a function that calculates the date range to be one
day, running daily. Some functions are
performed on the Data base side and some functions are only performed on the
Client side (user’s PC). So the
Administrator has created dates for you to acquire report efficiency.
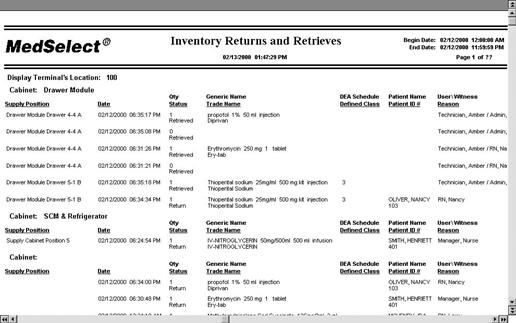
27. Save this report again in the MedSelect Scheduled Reports folder.
This report is now ready for scheduling
28. From
the Tools menu of Examiner, select Scheduler.
29. From
the Insert menu of Scheduler, select
Recurring Task.
The Insert Task window is displayed.
30. Click
on the Browse button.
31. Select
the report from the MedSelect Scheduled Reports folder.
32. In
the Description field, type Inventory
Return and Retrieve Report
33. Be
sure it is selected to execute on My Computer.
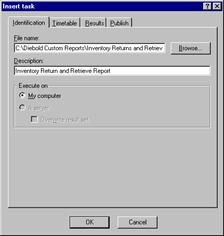
34.
Select the Timetable
tab.
35. Click
on the Daily radio button.
36. Select
any run time
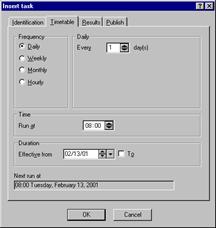
37. Click
on the Results tab and select a
printer
38. Click
OK.
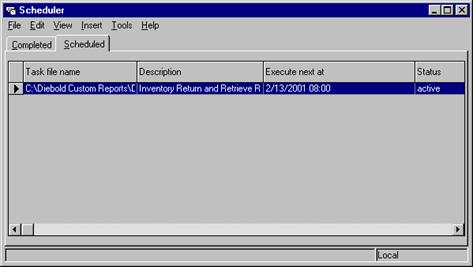
Notice the report is now in the Scheduler to
print.
Section 5
Demo 5:1 Advanced
Formatting
Objective: To create a report that displays Narcotic
Usage by User. The following frames will
be used: Form Frame, Text Frame, and
List Frame. This exercise will include
filtering, data definitions, and basic formatting.
This custom report will accomplish
the following objectives:
·
Display usage information by med/supply
·
Display only controlled substance usage
·
Display total usage by user
·
Display usage in chronological order
·
Utilize formatting to help the report be more
user-friendly
1.
From the menu bar, select File and then select New.
2.
Select the Simple
List template located under the Standard
tab.
3.
Click OK.
4.
Double click on the
Events folder to display its contents.
5.
Double click on the following to add them to the Query Data list:
·
Cabinet Location Number
·
Event Date
·
Quantity
·
Status Desc.
·
User Last, First
6.
Double Click on the Supplies folder to display its contents:
·
DEA Schedule
·
Supply Generic Name, Strength, Size, Units, Form
Because this report has an Event
Date it is necessary to create the Date filter expression before executing the
report.
7.
Select the Filter
Tab.
8.
Double click to open the Reports Column folder.
9.
Select Event
Date and >=.
10.
Next select Functions
and Add-Days
11.
Select Functions
and the expression Time-to-zero
12.
Again select Functions
and this time the expression Now.
13.
Next select Number
and change to –7, to make this a
weekly report.
14.
Select the ellipsis
(…) in the Filter Definition box to
indicate the completion of typing.
15.
Click on the And
button.
16.
Double click to open the Reports Column folder.
17.
Select Event
Date and <=.
18.
Repeat steps 10
– 12.
19.
Select Number
and double click to add to expression.
20.
Leave the number that is added to the expression at zero.
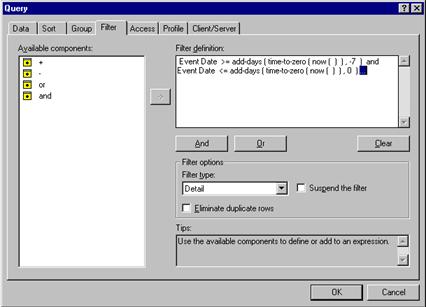
21.
Click on OK
to display the report.
22.
To allow for future enhancements to this report, change
the page orientation from portrait to landscape. To do so, select File, and then select Page
Setup. In the Page Orientation
section, select Landscape.
23.
Select OK to
display the report in landscape orientation.
24.
Change the view of this report to Screen Layout. From the View
menu, select Screen Layout.
25.
Press ESC to
clear any selections.
26.
Select a User
Name data element. While holding
down on the left mouse button, move the column to the far left and drop the column. (Do not drag into the column header, as this
will cause a cross tab query report to be created.)
27.
Select a Supply
Generic Name, Strength, Size, Units, Form date element. While holding on the left mouse button drag
the field to the far left and drop the column.
(Do not drag into the column header, as this will cause a cross tab
query report to be created.)
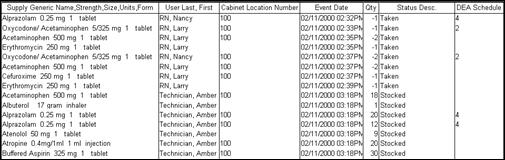
28.
Select any data item in the List Frame.
29.
From the Edit
menu, select Select Parent.
30.
The List Frame
is now selected (highlighted). To allow
room to create a Form Frame, size
the List Frame so it is displayed in
the lower half of the available screen display.
(Use the handles of the List
Frame).
31.
Press ESC to
clear the selection.
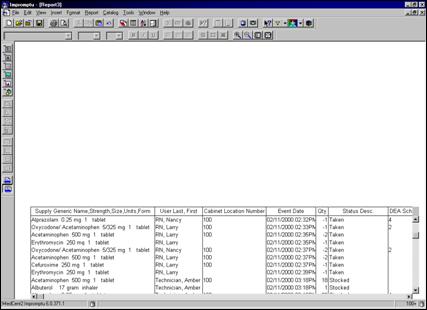
32.
Insert a Form Frame in the upper portion of the screen
display. To do so, select the Insert menu, then select Form Frame.
33.
Draw the outline of the Form Frame in the space just created.
34.
Select the first data item in the Supply Generic Name, Strength, Size, Units, Form column of the List Frame.
35.
Drag and drop it in the Form Frame.
36.
Each Supply
Generic Name, Strength, Size, Units, Form displays on a separate page. The objective is to display detail about each
Generic Name in the Form Frame. To view additional meds,
page down to the next pages. (This
cannot be accomplished until additional formatting is done.) Select any data item in the List Frame.
37.
From the Edit
menu, select Select Parent. (The entire List Frame is now selected.)
38.
This List Frame will be inserted into the Form Frame as
detail for each Supply Generic Name. From the Edit
menu, select Cut.
39.
From the Edit
menu, select Paste.
40.
Move the cursor (the refresh paint brush) into the Form Frame.
41.
Click to refresh the Form Frame. (It may be
necessary to resize the Form Frame and its contents.)
42.
Select the Form
Frame.
43.
Right-click and select Properties.
44.
Click the Layout
tab.
45.
For the Scope of Data, select Data in Group.
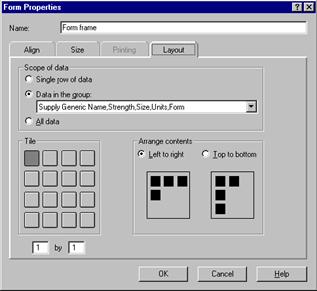
46.
From the Data in
Group drop down list, select Supply
Generic Name, Strength, Size, Units, Form.
47.
Click OK.
48.
Press ESC to
clear selections.
By setting the properties for the
Form Frame, the data is now grouped by Supply Generic Name. To verify this, open the Group dialog box and
note that Supply Generic Name is now grouped.
(From the Report menu, select Query. Select the Group tab option.)
The Form Frame has scroll buttons
to scroll through the list of supplies and their corresponding data. The List Frame that resides in the Form Frame
also has scroll buttons. This allows for
all data to be displayed for the corresponding supply even if the List Frame is
small.
Note:
The List Frame contains information for only one supply. Information on additional supplies can only
be accessed by scrolling to the next copy of the Form Frame.
Lets do some additional
formatting to make this report a bit more user-friendly.
49.
Move Supply
Generic Name, Strength, Size, Units, Form data element to the right side of
the report.
50.
The data field displaying the Supply Generic Name
should be labeled to indicate what this value is. From the Insert
menu, select Text Frame.
51.
Draw the outline of the Text Frame near the Supply Generic Name, Strength, Size, Units,
Form value. (Do not be too concerned
with the position of this frame since it can be easily moved.)
52.
Type in the name of the corresponding field: Supply
Generic:, hit ESC.
53.
Move the two Text
Frames so that they line up. (It may
be advisable to resize the frames as needed.)
54.
 Use
the alignment buttons to align the two Text
Frames.
Use
the alignment buttons to align the two Text
Frames.
55.
This report can also be improved by grouping the UserLast, First so that the user name
doesn’t appear with every line of associated data. It is also logical to have event dates in
chronological order. From the Report menu, select Query.
56.
Select the Group
tab and group by UserLast, First.
57.
Select the Sort
tab and sort the Event Date in Ascending order.
58.
Click OK.
59.
The Cabinet Location Number will be used in a Prompt but is not needed in this report
view.
60.
Select a data element in the Cabinet Location Number column and Delete the column
61.
Next Click
on a data element in one of the columns and Select parent to highlight the entire List frame.
62.
Next grab the left “handle
bar” and drag the frame to the right, resizing the frame.
Our report is significantly
improved. Notice that all events are
displayed including stocks, expirations, etc.
The objective of this report was to display usage for controlled
substances. Therefore, let’s filter the
event status to display only Taken, Wasted, Return, Patient Resolved Charge and
Patient Resolved Credit. The only
medications that need be displayed are those that are scheduled.
63.
From the Report
menu, select Query.
64.
Select the Filter
tab option.
We must add to the filter:
65.
Select “and”
Let’s create a filter definition
using the “in” operator and “select values”
66.
From Report
Columns select DEA Schedule
67.
Next select “in”
from the available components
68.
Next select the open parentheses ( and finally Select
Values
69.
Using the Ctrl
key, select as many elements as wanted in this case only Schedules 2, 3, and 4 are available in our database.
70.
Finally select the closed parentheses ) to
complete the expression.
71.
Click OK.
A bit more formatting will clean up
this report. Since we have filtered to
display only the scheduled medications, the DEA Schedule information is not
necessary to be displayed. Also, the
quantity information shows Taken events and negative and Return events as
positive. It would be nice to show the
Taken events as positive values and the Return events as negative values. It’s also easier to evaluate this report if
the quantities are summarized for each user.
72.
From the Report
menu, select Query.
73.
Select the Data
tab option.
74.
Click on the Events
folder.
75.
Select the Quantity
data item. (Do not double-click.)
76.
Click on the Summary
button  .
.
77.
Select the Total
button.

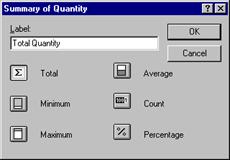
78.
Click OK.
79.
Total Quantity is now displayed in the Query Data box.
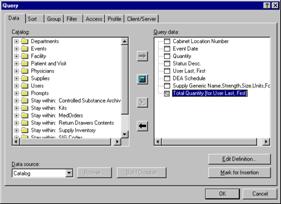
We want to display the negative numbers (taken events) to
positive numbers.
80.
With Total
Quantity selected, select the Edit
Definition button.
81.
Edit the Data
Definition field to read: total ( Quantity
) *
( -1 ) …
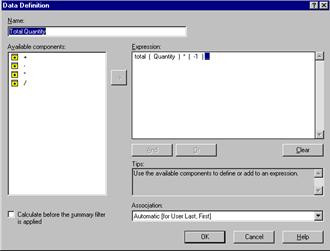
82.
Click OK.
83.
Click OK.
84.
With the Form
Frame displayed, select the Quantity
and DEA Schedule columns. (Use the control key to select both.)
85.
From the Format
menu, select Hide. (The Quantity
and DEA Schedule columns are no
longer displayed.)
86.
Select a data
field in the List Frame.
87.
From the Edit
menu, select Select Parent.
88.
From the Insert
menu, select Data.
89.
Click in the List
Frame to display the Data tab of
the Query dialog box.
90.
In the Query
Data list box, select Total Quantity.
91.
Select the Mark
for Insertion button.
92.
Click OK.
Finally, let’s filter this report
down to just Taken Events.
93.
Select a data element that has a value of Taken
in the Status Description column.
94.
From the drop down arrow to right of the filter button,
choose = and selection. This will filter
the report down to just the status desc. Taken that was selected.
This custom report now displays our
initial objectives.
95.
Save this
report in the MedSelect Custom Reports
folder and name it: Scheduled Medication
Usage by User.
Objective: To edit the previous report created
(Scheduled Medication Usage by User) by adding a Chart Frame and a Picture
Frame.
This custom report will accomplish
the following objectives:
·
Graphically display usage by user for each
Scheduled Medication.
·
Add a logo to the report.
·
Utilize formatting to help the report be more
user-friendly.
1.
From the menu bar, select Open
2.
Open the Scheduled
Medication Usage by User from the MedSelect Custom Reports
3.
From the Insert
menu, select Chart Frame.
4.
Draw the outline of the Chart Frame on the left side of
the current report.
The Chart
Properties dialog box is automatically displayed.
5.
From the Chart data list box, remove Quantity.
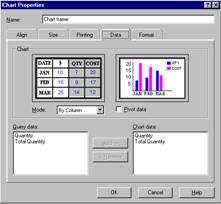
6.
Select the Format
tab.
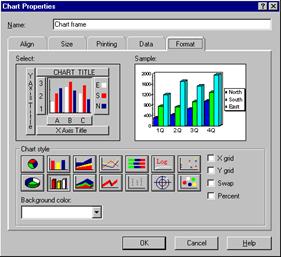
7.
The 3-D Bar
graph is selected by default. Keep
this selection.
8.
Select the Y
Axis Title button.
9.
In the Title
field, type in Qty.
10.
Select the Font
button.
11.
Change the font to Script
and select OK.
12.
Select the X
Axis Title button.
13.
In the Title
field, type in User.
14.
Select the Font
button.
15.
Change the font to Script
and select OK.
16.
Select the A B C
button.
17.
Select the Font
button.
18.
Keep the font the same but reduce the size.
19.
Click OK.
20.
Select the Chart
Title button.
21.
In the Title field, enter a chart title such as Narcotic Usage
22.
Select the Font
button and change the font to Bold
Italic and reduce the size.
23.
Click OK.
24.
Click OK.
Now, let’s rearrange the report so
that the use is displayed from the most to the least.
25.
Select the Query
Data box.
26.
Select the Sort
tab. Select the Total Quantity and change the sort to Descending.
The report now lists the use from
most to the least.
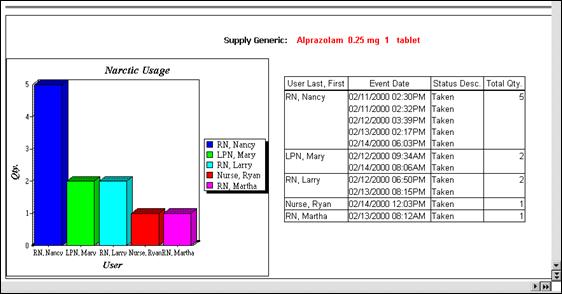
Additional formatting can be done to ‘spiff up’ this report.
1.
With the Chart Frame selected Format and the Borders.
2.
Select the Box button
and set the color to Gray.
3.
Click OK.
4.
From the Format
menu, select Styles
5.
Select Light
Emboss.
6.
Select Apply;
then select Close.
7.
Select the Supply
Generic text frame
8.
From the Format
menu, select Font.
9.
Change the font to Tahoma,
Bold and size 10.
10.
Click OK. (The fields may need to be resized.)
11.
Select the Text
Frame containing the database Supply
Generic Name, Strength, Size, Units, Form.
12.
From the Format
menu, select Font.
13.
Change the Font
Style to Bold and the Color to Red.
14.
Click OK.
Finishing this report will include adding a Location Prompt.
15.
Open the Query
Data box, select filter tab.
16.
Select the AND
button.
17.
From the Available
Components box, select Catalog
Columns.
18.
Select the Prompts
catalog folder.
19.
From the Prompts folder select the Cabinet Location sub-folder.
20.
Select the Cabinet
Location Prompt Key.
21.
Select the = operator,
open parentheses (.
22.
Returning to the Available
Components box, select Catalog
Columns.
23.
Select the Prompts folder.
24. From
the Prompts folder, select the
Cabinet Location folder, then, ?Cabinet
Location.
25. Finish
the expression with a closed parenthesis ).
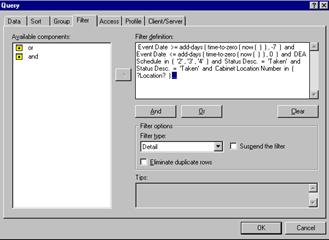
26.
The expression is complete. Click
on OK and you will be prompted to
select a location.
Finally it is necessary to add the location being displayed
to the report.
27.
From Insert
select Data and drag the icon  ,
to the left of the Supply Generic Name, left click and the Query Data box will
open.
,
to the left of the Supply Generic Name, left click and the Query Data box will
open.
28.
Select Cabinet
Location Number. From the Query
Data box, click on Mark for Insertion and OK.
29.
The Location
will appear in the Text frame.
30.
Insert a Text
Frame to the left of the Location Data element and Type in Location; hit ESC.
31.
Adjust and align the text box and Cabinet Location
box.
32.
Remove the Status
Desc from the report. Select a data
element in the Status Desc. column.
33.
Click the Delete
key to remove it from the report view.
34.
Select the Total
Quantity header. Change the title to
Total Qty.
35.
Change back to Page
Layout View. By going to View Page Layout
36.
Double click on Header Text and type 7-Day Narcotic Usage Graph Report
If this report
were for a presentation, it would be nice to display the hospital logo at the
top.
37.
From the Insert
menu, select Picture Frame.
38.
Draw the outline of the Picture Frame in the upper right hand corner of the current report.
39.
The Picture
Properties dialog box is automatically displayed.
40.
With the Source tab selected, select the Browse button.
41.
The MedSelect logos are located in the Logo folder on
the C: drive. Select the logo called MedSelect.bmp
42.
Click Open.
43.
Click OK.
44.
To delete the border of the Picture Frame, select Format and then select Borders.
45.
Select the None
button and then click OK.
Additional formatting can be done
until the report is as you desire.